Every dose, and fifteen ways to draw the trend underneath it.
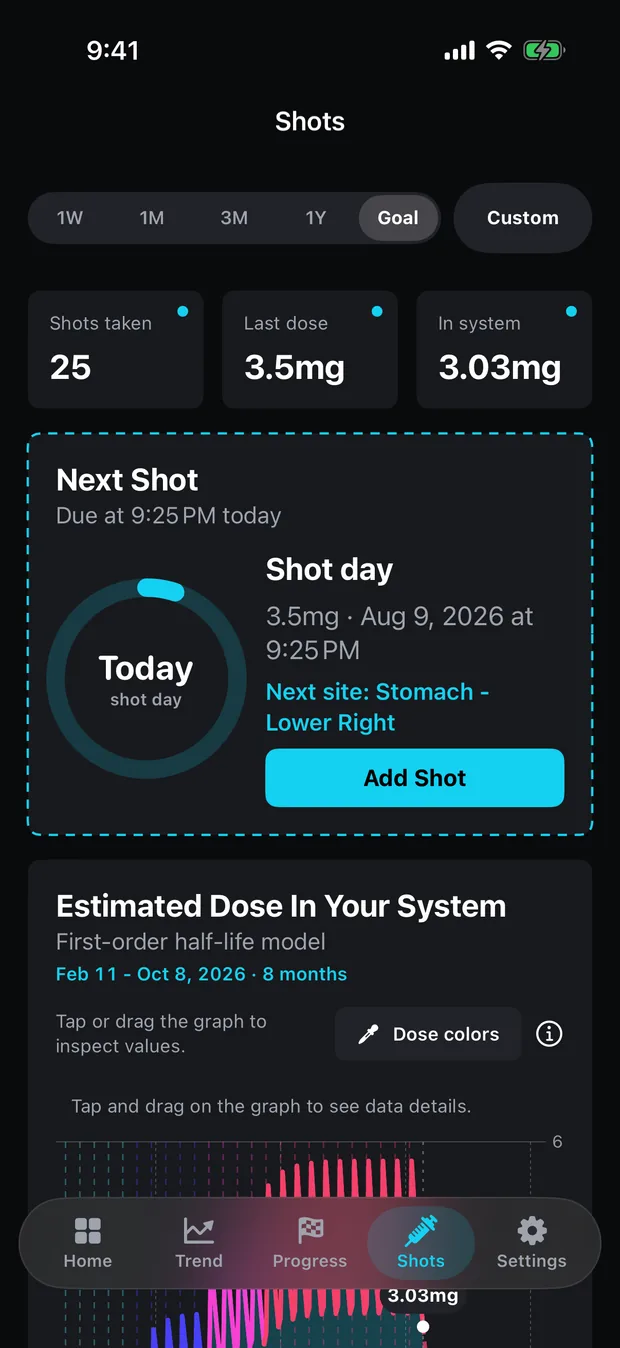
Peptrend logs every injection or tablet, estimates what is still circulating from the medication's own half-life, and draws a smoothed line through your weigh-ins on the same axis. Fifteen methods are available and the mathematics for each one is published.
The bars are to scale. The thing you are trying to read is 12× smaller than the daily noise sitting on top of it.
1.0–3.6 mg · 67% of the way to a 175 lb target
Where this came from
The idea started with a joke about a portfolio chart looking like a weight chart. Both are noisy series with a slow signal underneath, and both get misread on any single day's reading.
The rest came from what a protocol actually leaves you to track. With the eating side largely handled, the open questions are narrow: how much went in, how much is still there, and what the weight is doing under the daily swing. Peptrend is built around those three. Nothing here assumes which direction the line should go — it reads a rising trend the same way.
The dose is on the same axis as the weight
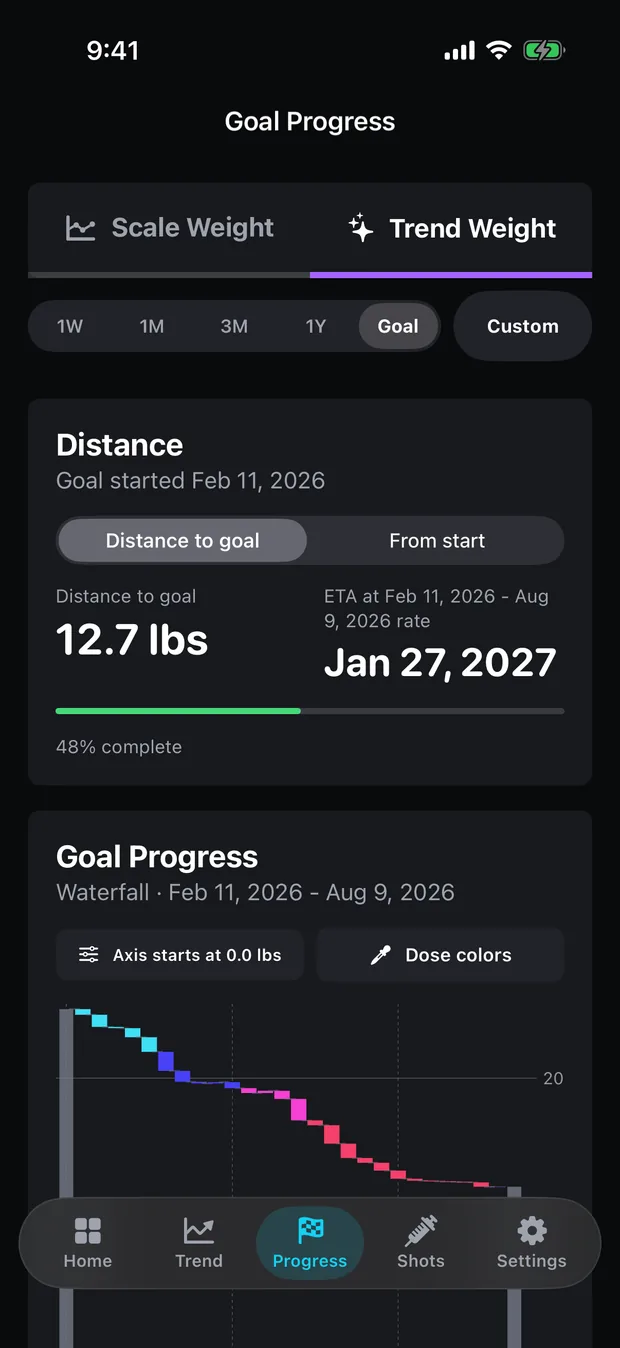
Each weigh-in below is coloured by the dose in effect that week, so the colour of the weight data moves as the dose does — up through the titration, and back down where this user stepped a dose back. Drawing the two against one clock needs both series and a smoother you can name; this one publishes fifteen of them and the parameters each runs at.
Fifteen filters, one dataset, fifteen different last-three-months
Every line below is drawn from the same 84 weigh-ins. They agree in the middle and splay apart at the ends, and on the final day they disagree by four pounds. Which one you pick is a choice about how much lag you will accept.
Classic
From technical analysis
Statistical
Robust
Every line is the same 84 weigh-ins under a different filter. Pick one to ink it.
What it will not do
Tell you what to draw
The reconstitution screen turns vial strength and water volume into a concentration in mg/mL and stops there. Working out a dose or a syringe volume is between you and your prescriber, and App Review guideline 1.4.2 treats it as a regulated calculation rather than a convenience.
Ask what you ate
There is no food log, no macros and no barcode scanner. The energy-deficit figure is inferred from the slope of your own trend line and nothing else.
Claim a blood level
The figure under “in your system” is a decayed milligram estimate built from a published half-life. It has no volume of distribution and no clearance term, it is not individualised, and it has never been checked against your blood work.
Make you an account
No sign-up and no server of ours. Sync runs through your own private iCloud database between your own devices, which is why we cannot read your data, recover it, or restore it for you.
Promise you a result
Peptrend records what you enter and does arithmetic on it. It does not predict an outcome, recommend a dose, or claim that anyone loses any particular amount.
Logging is free, and stays free
Every weigh-in and every dose you record is yours at no cost, along with the raw weight chart, your full history, import, export, weigh-in sync with Apple Health and iCloud sync. Pro buys the smoothed trend and the analysis built on it.
Monthly
$12.99
per month · 7 days free first
Yearly
$69.99
per year · 7 days free first
Lifetime
$99.99
once · not a subscription, so no trial
Prices in US dollars; other regions follow Apple's pricing tiers and are shown in the app before you buy. A free trial is offered on the two subscriptions only, and only if you have not used one before. Subscriptions renew until cancelled, and you can cancel in your Apple account settings.
Writing
- Does oral semaglutide have the same half-life as the injection?About a week either way. The interval is what differs: a daily tablet ripples by about 10%, while a weekly injection swings by a factor of two.
- Shotsy vs Peptrend: GLP-1 dose logging and weight trend mathsShotsy is one of the two largest GLP-1 trackers, and its shot log and site rotation are the better half of it. It names no smoothing algorithm. Checked 18 Sep 2026.
- How fast is too fast to lose weight? The 1.5 lb/week capPeptrend refuses any plan faster than 1.5 lb a week and greys out Save. Where that cap sits against published rates, and how the rate, ETA and deficit are computed.