How to read dose markers and level shading on a weight chart
Each dashed vertical line is one logged dose, coloured by its own colour or by size, with a label on the first, the last and every dose change. The shaded band along the bottom is the in-system estimate for one medication, scaled so its peak reaches 28% of the chart's height, with no axis of its own. Both show timing. Neither shows that a dose moved the weight.
Peptrend can draw your doses on the same chart as your weight, which is the point of the app’s name: dose first, trend second. Three kinds of mark do it, and each is scaled in a particular way. Reading them correctly mostly means knowing what each one leaves out.
Where do doses appear on a weight chart?
On three charts, two of them optional:
- The Scale tab’s chart, which is free. Its switches read “Show your shots on the chart” and “Show dose in your system”.
- The Trend tab’s Weight Trend chart, which is Pro. Its switches are the dose noun (“Shots” or “Doses”) and “Circulating”.
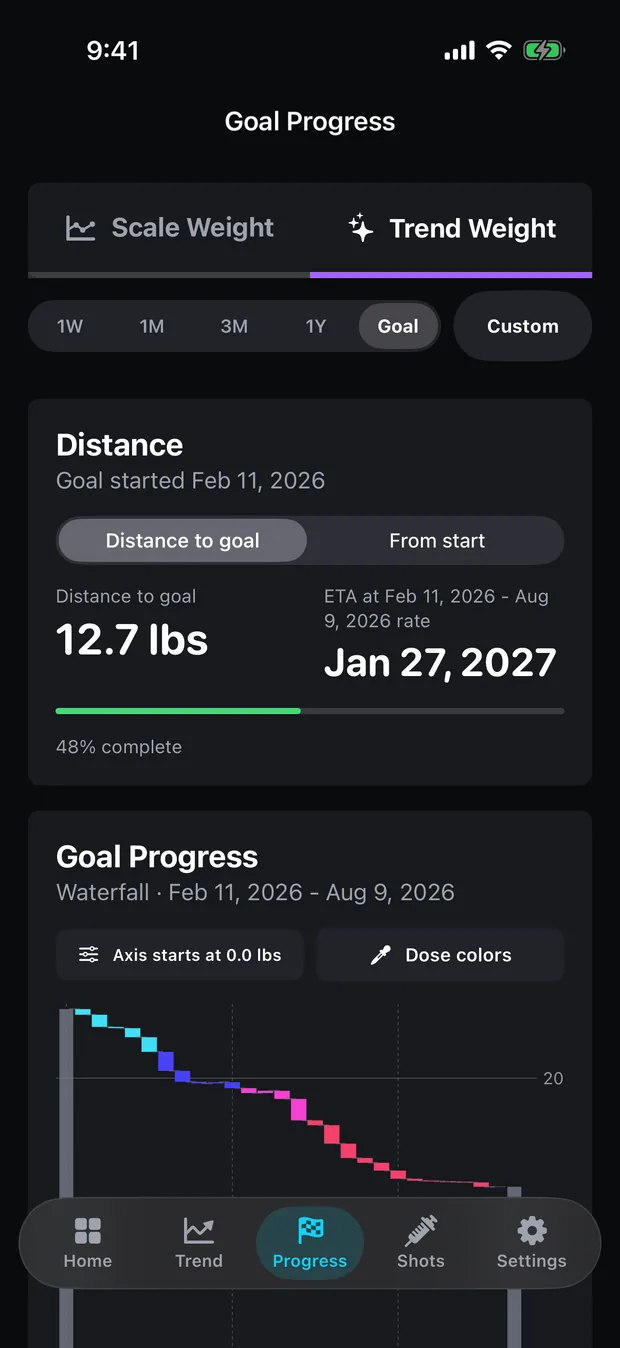
- The goal waterfall on the Progress tab, which is Pro, where the Dose colors button shades each weekly bar.
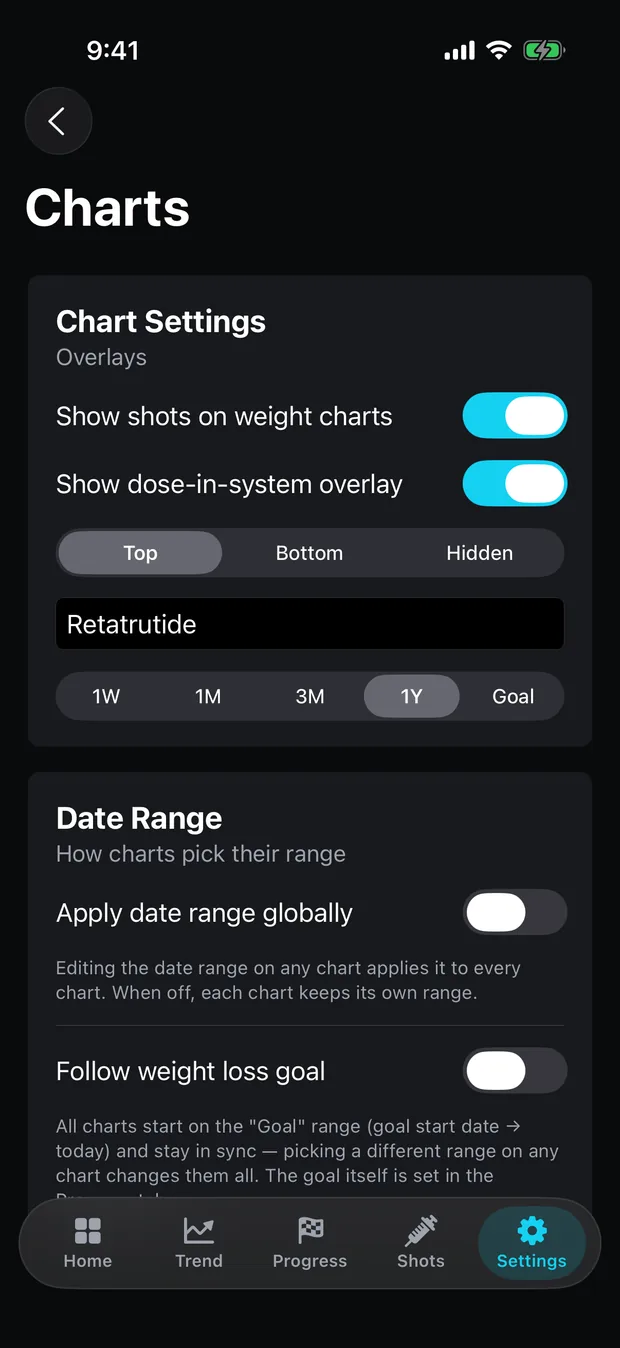
Settings › Charts holds the defaults for the first two: “Show shots on weight charts”, “Show dose-in-system overlay”, where dose labels sit (Top, Bottom or Hidden), and which medication the shading follows.
What does each dashed line mean?
One dose you logged as taken, at its date and time. Untaken entries are not drawn. The line is dashed so that it reads as a moment rather than a value: it has no height on the weight axis.
Some lines carry a small capsule with the amount. With six or fewer doses on screen, every one is labelled. With more, the app labels the first, the last, every dose that differs from the one before, and every few in between, so a dose change is always marked and a long steady run is not a wall of identical labels.
What decides a marker’s colour?
Either the colour saved with the dose, or its size. By default each dose keeps its own colour, picked from a cycle when you log it, which is free. With Dose Colors on (Pro), the colour comes from the dose in milligrams on a ramp that runs from your lowest logged dose at one end to your highest at the other, across the whole history, so a dose keeps its colour when you change the range.
The ramp knows milligrams and nothing else. With more than one medication in the log, a larger dose of one drug is shaded as heavier than a smaller dose of another, whatever the drugs. Five of the seven built-in ramps keep a consistent light-to-heavy order; how to chart a titration covers which, and why rainbow ramps mislead.
What is the shaded band along the bottom?
The in-system estimate for one medication, drawn as a translucent area rising from the bottom of the chart. It comes from the same model as the In Your System chart on the Doses tab: each dose absorbed toward its published time to peak and halving every half-life.
Its scale is deliberate. The band has no axis. The estimate’s highest point, taken across the whole computed curve including its projection, is drawn at 28% of the chart’s height, and everything else is in proportion to that peak, so the band in view may never reach the full 28%. So the band shows when the estimate rose and fell relative to your weigh-ins, and nothing about how many milligrams were involved; a band that looks twice as tall is twice the modelled amount only within the same view. Scrub the chart and the readout adds “In system” with the milligram figure for that moment.
The band follows one medication: the name in Settings › Charts, which a switch of main medication updates. With two medications on the go, the second one’s curve is on the Doses tab, not here. How much is still in your system explains the model, and its figure is a decayed milligram estimate, never a blood level.
What does the dose-coloured waterfall show?
Weekly change toward the goal, coloured by dose. The waterfall on the Progress tab has one floating bar per 7-day bucket of the goal. With Dose colors on, each bar takes the colour of the last dose logged as taken inside that week, on the same ramp as the markers. A week with no dose keeps the default colour.
It makes a titration easy to see as a run of colours across the weeks. It does not attribute any week’s change to the dose in it.
What can these marks not tell you?
Whether a dose did anything to the weight. On one user’s log of 84 weigh-ins over 225 days, readings moved by 1.16 lb of change from one to the next on average, against an underlying drift of 0.098 lb/day, so the daily noise is 11.9 times the daily signal. A dip after a dashed line is, most of the time, the noise doing what it does on any other day. The signal-to-noise post works out how long it takes for a real change to show through.
Lining a dose up with a weight move also invites regression to the mean: a reading taken after an unusually high one tends to be lower, whatever happened in between. The chart puts the two series on one axis so you can see their timing together. It takes no position on cause, and it does not assume the line should go down; a rising trend is drawn and read the same way. What stays free lists which of these charts need Pro, and the methods page has the maths behind the trend line the markers sit on.
Common questions
What do the dashed lines on Peptrend's weight chart mean?
Each one is a dose you logged as taken, drawn at its date and time. Its colour is the dose's own colour, or a shade set by its size when dose colours are on, and some carry a small label with the amount.
What is the shaded area at the bottom of the weight chart?
The estimated amount of one medication still in your system, from the same model as the In Your System chart. It is scaled to reach 28% of the chart's height at its peak and has no axis, so read its shape, not its height.
Can I see doses on the weight chart for free?
Yes. The Scale tab's chart is free and has switches for showing your doses and the dose in your system. The Trend tab's smoothed chart and the dose-coloured goal waterfall are Pro.
Sources
- Stoelzle M, Stein L. Rainbow color map distorts and misleads research in hydrology. Hydrology and Earth System Sciences, 2021
- Barnett, van der Pols & Dobson — 'Regression to the mean: what it is and how to deal with it', International Journal of Epidemiology 34(1):215–20 (2005)
- Hallare J, Gerriets V. Elimination Half-Life of Drugs. StatPearls, NCBI Bookshelf