
Why did I gain weight overnight? Water, glycogen and gut contents
An overnight gain of two or three pounds is water, glycogen and gut contents, all of which move faster than fat does. In this user's log — 84 weigh-ins over 225 days — the average day-over-day move was 1.16 lb against an underlying drift of 0.098 lb/day. The noise is 11.9 times the signal, which is what a trend line exists to strip out.
You stepped on the scale yesterday at 186.4. This morning it says 189.1. You did not eat 9,450 surplus calories in one evening, and you know it, and the number is still there.
How much can your weight change in a day?
About a pound on an ordinary morning, and 5.4 lb on the worst one in this file. Both come from one user’s log — 84 weigh-ins over 225 days. Over that span the log fell 22.0 lb net, inside a range running from a 205.0 lb high to a 183.0 lb low. Divide the drop by the days and the underlying rate is 0.098 lb per day.
Now measure how far the scale actually travelled between consecutive weigh-ins. The mean day-over-day change was 1.16 lb, with a standard deviation of 1.45 lb. Median absolute change: 1.2 lb. Ninetieth percentile: 2.2 lb. Largest single-day swing in the file: 5.4 lb.
So the quantity you are trying to read — fat, roughly a tenth of a pound a day — sits underneath a quantity nearly twelve times its size that moves every single night. That ratio, 11.9 to 1 noise to signal, is why a single weigh-in tells you almost nothing on its own. How long a real change takes to clear that noise takes a post of its own.
The three pounds are real weight. Your body genuinely is three pounds heavier than it was yesterday. It is just not three pounds of the thing you were measuring.
Where does an overnight gain come from?
Four sources, none of them fat, all of them fast.
Glycogen and its water. Muscle and liver store carbohydrate as glycogen, and glycogen is stored wet. Fernández-Elías and colleagues measured muscle biopsies during recovery from prolonged exercise in the heat and found that under limited fluid replacement, “per each gram of glycogen, 3 g of water was stored in muscle” (Eur J Appl Physiol, 2015). Olsson and Saltin had tied whole-body water to muscle glycogen back in 1970. Refill a few hundred grams of glycogen after a low-carb day and you carry roughly three times that mass in water with it.
Sodium. A salt load pulls water in behind it. Bankir and colleagues put it plainly: “This water retention is responsible for the well-described rise in body weight observed after a sudden rise in daily sodium intake” (Ann Nutr Metab, 2017). One restaurant meal is enough.
Gut contents. Food and drink weigh what they weigh from the moment they go in until they leave. A litre of water is 2.2 lb on the scale the instant you drink it.
Measurement timing. Weighing before a shower on Tuesday and after breakfast on Wednesday introduces a difference that has nothing to do with your week.
Why does the scale go up in a week you were losing?
Of the 83 intervals between consecutive weigh-ins in this user’s log, 30 showed a gain. That is 36% of the time, in a log that ended 22.0 lb lighter than it started. Read one interval at a time and better than a third of the record points the wrong way; the 22 lb only appears when you take all 225 days together.
The pattern is not random either. Turicchi and colleagues tracked weekly weight rhythms across a European weight-loss-maintenance trial and found body weight peaked on Monday and bottomed on Friday, with a fluctuation of about 0.35% of body weight across the cohort — near 0.3 kg, larger in men (0.41%) than women (0.29%) (PLOS ONE, 2020). If you weigh on Monday mornings only, you are sampling the top of a wave once a week and calling it your weight.
Which is why the app puts two numbers for the same body next to each other: on the last morning of this user’s log the scale reads 183.0 lb and the default trend line reads 185.0 lb, 2.0 lb apart.
What does a weight trend line actually do?
Each new trend value is a weighted mix of the latest weigh-in and the trend you already had. The clearest statement of the idea for weight tracking is John Walker’s, in the chapter Signal and Noise from The Hacker’s Diet — a work from the 1990s, revised in 2005. Walker borrowed the exponentially smoothed moving average from stock charting: keep 90% of yesterday’s trend, add 10% of today’s reading, repeat tomorrow.
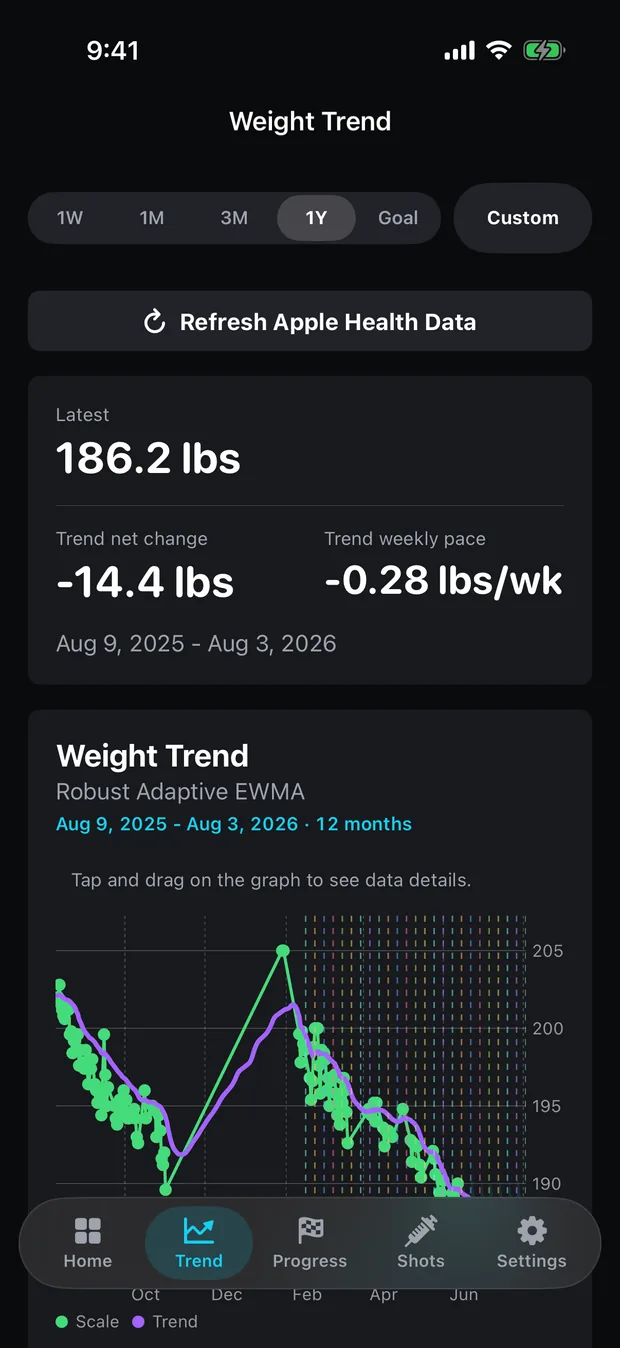
Peptrend ships that filter under the name Hacker’s Diet with α fixed at 0.1 and gap-filling deliberately off, plus fourteen others. The default is Robust Adaptive EWMA, which stacks three mechanisms on the same recurrence: an efficiency ratio that raises α from 0.04 toward 0.22 when the scale is moving in one consistent direction, a MAD-based down-weight that shrinks the influence of any reading more than 2.5 estimated deviations off the line, and straight-line interpolation across missed days.
The rate reported beside that line comes from the line itself: today’s trend value minus its value seven points earlier. Every parameter is documented on the methods page, including the ones you can edit.
How much of the daily swing does a trend line throw away?
Most of it, and how much is the choice you make when you pick a method. Run the fourteen methods that work off the daily series over the same 84 weigh-ins, at their shipped defaults, and they disagree. “Line moves” is the mean absolute day-to-day change in the trend line itself; “scale movement ignored” is the share of the raw daily movement the line does not pass through.
| Method | Line moves/day | Scale movement ignored | Final reading |
|---|---|---|---|
| SMA | 0.295 lb | 74.7% | 184.7 lb |
| EWMA | 0.103 lb | 75.9% | 184.5 lb |
| Hacker’s Diet | 0.229 lb | 80.3% | 186.0 lb |
| KAMA | 0.080 lb | 81.3% | 187.0 lb |
| HMA | 0.368 lb | 14.3% | 182.9 lb |
| Robust Adaptive EWMA | 0.094 lb | 78.1% | 185.0 lb |
The raw scale moved 1.16 lb a day. The steadiest line here moves 0.080 lb a day and throws away 81.3% of that motion; the twitchiest moves 0.368 lb and keeps almost all of it. Across those fourteen methods the final readings span 4.0 lb, from 182.9 to 187.0, on identical data. That column records a choice about how much lag you will accept in exchange for how much calm, which is the whole of choosing a trend method — and a reason to understand how EWMA actually behaves before you start editing parameters.
What should you do with a single weigh-in?
Log it and look away. One reading is a single draw from a distribution whose day-to-day spread is 1.45 lb, against 0.098 lb of real change underneath. Weigh under the same conditions each time so the timing term stops contributing, and let the line collect the evidence for you.
Consistency beats precision here. In a cohort of 9,768 smart-scale users followed for a mean 1,085 days, the average was 2.8 weigh-ins per week, and weighing frequency correlated inversely with weight change (JMIR, 2021) — correlational, and the authors say so. The mechanics are less arguable: more readings give the filter more to work with, and days you skip get either interpolated or dropped, depending on the method. If your weight already lives on your phone, pulling the back-history in from Apple Health gives the line something to stand on from day one.
Set a goal rate the data can actually support — the app refuses any plan above 1.5 lb/week for exactly this reason. If you log doses alongside weight, settle early on what to record with each one, so the two series line up when you go back to read them. The raw weigh-in chart, the full history, and every entry you log stay free; the smoothed trend chart sits behind Pro.
Three pounds overnight is water finding a new place to sit. The line underneath it is the thing you were trying to read.
Common questions
How much can your weight fluctuate in a day?
In this user's log — 84 weigh-ins over 225 days — the average day-over-day move was 1.16 lb, the 90th percentile was 2.2 lb, and the largest single-day swing was 5.4 lb. Three pounds between two mornings sits above the 90th percentile: uncommon, and still well short of the biggest move in the log.
Why did I gain weight overnight when I ate less?
Because one morning's number is dominated by water, glycogen and undigested food, all of which move faster than fat does. Across the same 225-day log, 30 of 83 intervals — 36% — showed a gain, and the log still finished 22.0 lb down.
Does a smoothed trend line hide real weight gain?
It delays it. Peptrend's default method moves 0.094 lb per day and passes through only 21.9% of the scale's daily movement, so a genuine reversal takes several days to show up in the line rather than appearing on one reading.
Should I weigh myself every day?
More readings give any filter more to work with, and gaps have to be interpolated or skipped. A cohort of 9,768 smart-scale users followed for a mean 1,085 days averaged 2.8 weigh-ins a week, and the study reported an inverse correlation between weighing frequency and weight change of r = -0.111, which its authors describe as very low and do not claim as causal.
Sources
- Fernández-Elías et al., Relationship between muscle water and glycogen recovery after prolonged exercise in the heat in humans, Eur J Appl Physiol (2015)
- Olsson & Saltin, Variation in total body water with muscle glycogen changes in man, Acta Physiol Scand (1970)
- Bankir et al., Relationship between Sodium Intake and Water Intake: The False and the True, Ann Nutr Metab (2017)
- Turicchi et al., Weekly, seasonal and holiday body weight fluctuation patterns among individuals engaged in a European multi-centre behavioural weight loss maintenance intervention, PLOS ONE (2020)
- Vuorinen et al., Frequency of Self-Weighing and Weight Change: Cohort Study With 10,000 Smart Scale Users, JMIR (2021)
- John Walker, The Hacker's Diet, chapter: Signal and Noise (Fourth Edition, 2005)