
Which weight trend method should you use? Fifteen, measured
Robust Adaptive EWMA, the app's shipped default. It sets its own smoothing constant from a 14-day efficiency ratio and caps how far one bad reading can pull the line, moving 0.094 lb a day and ignoring 78.1% of the scale's daily movement on one user's 225-day log. Three reasons override it: a scale you do not trust, a rate you care about more than a level, and a log with two weigh-ins a week.
Which trend method should you use?
Robust Adaptive EWMA, which is the shipped default. It should stay there unless you can name the reason you are changing it. The method’s own card in the app lists “Recommended default” first under Pros and gives its best use case as “The default daily driver for meaningful body-weight trend tracking.” Nothing on this page is going to talk you out of that.
Three reasons are good enough to override it:
| If you have | Switch to | Because |
|---|---|---|
| A scale you have concrete reason to distrust — a shared household, a run of hotel bathrooms | Rolling Median | Its resistance to a bad reading is a ceiling rather than a tendency. Double the size of the error and its miss does not grow. |
| More interest in how fast you are moving than in what you weigh | Kalman Filter | It is the only method that carries a velocity as part of its state and reports that, instead of differencing the drawn line against itself seven points back. |
| Two weigh-ins in a typical week | Weekly Average | It is the only method that never touches the daily series, so it never smooths a day you did not measure. |
The other eleven are worth reading about. None of them is worth a Tuesday-afternoon switch. Method-hopping is the failure this post exists to prevent: you change the line, the number moves half a pound, you read that as progress or its absence, and you have learned nothing about your body. Pick once, then leave it alone for long enough that the line is telling you about the weeks and not about the settings.
How different are the methods, really? 4.0 lb apart on identical data
On one user’s real log — 84 weigh-ins over 225 days, from a 205.0 lb high down to 183.0 — every method reads the same numbers and lands somewhere different. “Line moves” is the mean absolute day-to-day change in the trend line; “ignored” is the share of the scale’s own daily movement the line does not pass through.
| Method | Line moves/day | Scale movement ignored | Final reading |
|---|---|---|---|
| HMA | 0.368 lb | 14.3% | 182.9 lb |
| Weekly Average | 0.196 lb | 83.1% | 183.0 lb |
| Kalman Filter | 0.406 lb | 5.5% | 183.0 lb |
| TEMA | 0.196 lb | 54.4% | 183.3 lb |
| Savitzky-Golay | 0.163 lb | 62.0% | 183.4 lb |
| Holt-Winters | 0.150 lb | 65.1% | 183.5 lb |
| DEMA | 0.152 lb | 64.7% | 183.6 lb |
| Linear WMA | 0.345 lb | 70.4% | 184.3 lb |
| EWMA | 0.103 lb | 75.9% | 184.5 lb |
| SMA | 0.295 lb | 74.7% | 184.7 lb |
| LOESS | 0.074 lb | 82.8% | 184.7 lb |
| Robust Adaptive EWMA (default) | 0.094 lb | 78.1% | 185.0 lb |
| Rolling Median | 0.304 lb | 73.9% | 185.0 lb |
| Hacker’s Diet | 0.229 lb | 80.3% | 186.0 lb |
| KAMA | 0.080 lb | 81.3% | 187.0 lb |
Weekly Average produces one point per calendar week, so its movement figure is a week’s step divided by seven, put that way only to sit on the same scale as the rest. Never read it as a daily number.
Top to bottom the disagreement is 4.0 lb, over a stretch where the scale itself fell 22.0 lb and moved a mean of 1.16 lb from one weigh-in to the next. The entire argument among fifteen methods is worth about three and a half ordinary days of noise. And in the middle of that table, five of the heavily damped methods — EWMA, SMA, LOESS, Robust Adaptive EWMA, Rolling Median — finish within 0.5 lb of each other. If you are switching among those hoping for a different answer, you are switching for a tenth of a pound at a time.
How does the default pick its own smoothing constant?
Two mechanisms stack on one exponential recurrence. The app prints the formula on the method’s own card:
alpha = slow + ER * (fast - slow)
effectiveAlpha = alpha * outlierWeight
T_t = effectiveAlpha * W_t + (1 - effectiveAlpha) * T_t-1
ER is Kaufman’s efficiency ratio over a 14-day window: net displacement divided by total path length, published as Change/Volatility in the adaptive moving average he built around it. A straight run scores 1, a round trip scores 0. It slides α between a slow 0.04 and a fast 0.22, and — unlike KAMA, which squares the result — the blend here is used as it comes out.
A small α gives more weight to the distant past, a large one to the recent. As the survival time of a single weigh-in:
| Efficiency ratio | α | Half-life of one weigh-in |
|---|---|---|
| 0.00 — pure round trip | 0.040 | 17.0 days |
| 0.326 — this log’s median | 0.099 | 6.7 days |
| 1.00 — perfectly straight | 0.220 | 2.8 days |
| EWMA at its default α, for reference | 0.100 | 6.6 days |
On this log the efficiency ratio has a median of 0.326 and a mean of 0.459, putting the median α at 0.099 before the outlier weight and 0.080 after. Plain EWMA runs at a flat 0.1, so for most of its life the default is moving at almost exactly the speed of the thing it replaces. It finishes half a pound higher — 185.0 lb against 184.5 — and travels 0.094 lb a day against 0.103. Adaptiveness pays at the two ends of the efficiency-ratio range. In the middle, where a body spends most of its time, it is buying you a hundredth of a pound.
What makes it robust? Past 2.5 sigma, one reading can only pull the line so far
The outlier weight is the second mechanism, and the reason to prefer this over a plain exponential average. Each day it takes the last 14 residuals between the weigh-ins and the line and computes their median absolute deviation, scaled by 1.4826 — the constant that makes MAD estimate the standard deviation of normal data — with a floor of 0.05 kg. Multiply by k = 2.5 for the threshold. A residual inside it passes at full weight. A residual outside it gets multiplied by threshold ÷ residual.
Work through what that division does. The line moves effectiveAlpha × residual, which for a down-weighted day is alpha × (threshold ÷ residual) × residual, which is alpha × threshold. The residual cancels. However wrong the reading is — 5 lb, 50 lb — the line travels exactly the same distance, and that holds to machine precision on every down-weighted day in the file. This is Huber’s bounded-influence idea, where the cost of an error stops growing quadratically past the tuning constant and grows linearly instead.
The branch is not exotic. On this log it fires on 74 of 225 daily steps, and on 32 of the 83 weigh-in days that follow the first. The threshold has a median of 1.34 lb and a 90th percentile of 3.16 lb — tight when the line has been fitting well, wide after a rough fortnight. The largest single-day step the default line takes anywhere in the 225 days is 0.434 lb, on a file whose biggest jump between consecutive weigh-ins is 5.4 lb.
Which method survives a bad scale reading best?
Rolling Median, by about a third of a pound at one moderate error. Here is the test: add 10 lb to exactly one weigh-in, re-run the filter, and record how far the line moved at its worst. Repeat at all 70 positions with a full window either side, then double the error.
| Method | One +10 lb error | Same error, doubled to +20 lb |
|---|---|---|
| Robust Adaptive EWMA | 0.72 lb typical, 2.45 lb at the 90th percentile | 0.91 lb typical, 4.19 lb at the 90th percentile |
| Rolling Median, 7 values | 0.40 lb typical, 1.20 lb at the 90th percentile | 0.40 lb typical, 1.20 lb at the 90th percentile |
The rolling median is the steadier of the two in both columns, and the second column shows why. A median never touches a corrupted value’s magnitude, only its rank, so doubling the error changes nothing at all — the same 0.40 lb typical, the same 1.20 lb at the 90th percentile. The default caps each day on its own terms, but a big reading also enters the next fortnight of residuals and widens the threshold behind it, so its worst case keeps growing. At one moderate error the gap between the two is about a third of a pound, which is less than the scale’s own mean day-to-day change.
The default’s worst placements sit at the edges of long gaps: the two ends of this log’s 45-day pause take 7.43 lb and 6.56 lb. Interpolation is why — a bad reading beside a gap gets carried across every filled-in day, and each of those days takes its own capped pull in the same direction. Robust Adaptive EWMA follows the global interpolation setting, so switching it off is a lever — and it changes far more than this. what one bad weigh-in does to a trend line has the full case, including what the stepped line costs you.
Which method tracks how fast you are moving right now? The Kalman filter
Thirteen of the fifteen methods derive their rate by subtracting the trend value seven indices back from the current one — the slope of the past week, reported today. Weekly Average differences its own weekly means. The Kalman filter instead holds your rate as part of its state, pushes it forward a day, and corrects it by a share of each morning’s surprise, then multiplies by seven. It is an estimate of how fast you are moving now.
The bill arrives in both columns above. The Kalman line ignores 5.5% of the scale’s daily movement where the default ignores 78.1%, and moves 0.406 lb a day against 0.094 — nothing in the app tracks the raw dots more closely. Its rate swings accordingly: on this log the modelled velocity averages 2.64 lb/week in magnitude with a standard deviation of 4.30, against 1.15 and 1.38 for a seven-index look-back read off that same Kalman line. Pick it if you would rather have a jumpy current answer than a smooth stale one, and be honest about which you will act on. It sits behind Advanced Mode, which is Pro.
What should you use if you weigh in twice a week? Weekly Average
Fourteen of the fifteen methods run on a daily series, and most of them fill a day with no weigh-in by drawing a straight line between the days either side. On this log that means 142 of the 226 daily points — 63% — were never measured. The four that never interpolate — SMA, Linear WMA, Hacker’s Diet, Rolling Median — swap that problem for another: a seven-value window holds the last seven times you stood on the scale, however long that took. In a cohort of 9,768 smart-scale users followed for a mean 1,085 days, the median participant managed 2.80 measurements a week, and the mean share of days carrying a weight was 39.98%. At that cadence a daily filter is mostly smoothing its own arithmetic.
Weekly Average bypasses the apparatus. It groups your actual weigh-ins by calendar week, plots the mean at the week-start date, and reports the rate as this week’s mean minus last week’s. No filled-in days, no smoothing constant, nothing to tune. This log’s 84 weigh-ins land in 24 of the 33 calendar weeks it spans, an average of 3.5 per populated week.
What you give up is the daily line — one point a week, and the newest point is thin until the week closes. This log ends on exactly that: a final week holding one weigh-in, so the last plotted average is that single number, 183.0 lb. The app’s own card is blunt about the tradeoff — it describes the behaviour as “Slow but easy to trust” and lists “Slow” and “Not a polished daily trendline” under Cons.
What about the other eleven?
Two carry a caveat that decides the question for you. LOESS and Savitzky-Golay both read points on either side of the day they are drawing, so the right-hand end of the line changes when tomorrow’s weigh-in arrives. Whatever they are good for, watching today is not it. Hacker’s Diet is a fixed α of 0.1 with interpolation forced off, the 1990s original, and at 186.0 lb it finishes higher than everything on the file except KAMA. HMA removes 14.3% of the scale’s daily movement, second least of the fifteen behind the Kalman filter’s 5.5% — it tracks the raw dots so closely that it ends up below the last weigh-in.
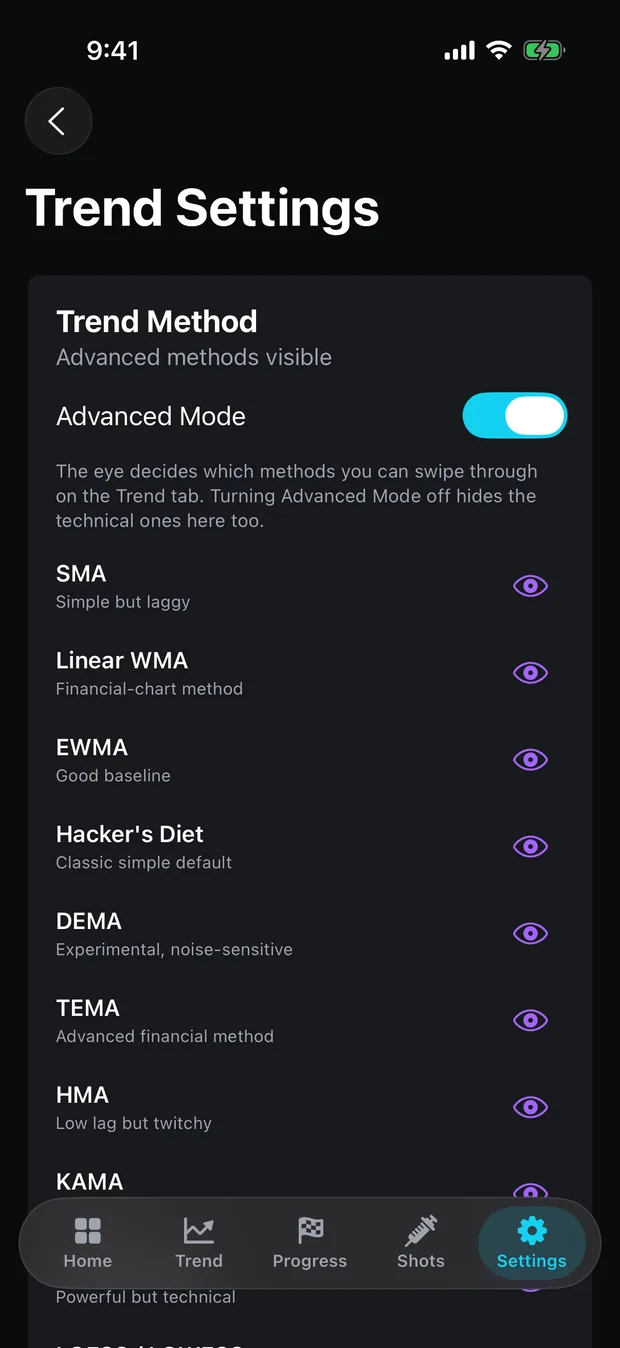
The app will never make this choice for you. There is no automatic method selection, no per-user tuning and no machine learning in it anywhere — the method you pick is the method that runs, at the shipped parameters until you edit them. Rolling Median and Weekly Average are visible without Advanced Mode, alongside the default and Hacker’s Diet; the other eleven, the parameter editor and the Weight Trend chart itself are Pro, and the free tier keeps the raw scale chart on the Scale tab.
One last number to put the fiddling in proportion. A review of 17 studies in Obesity found that regular self-weighing was associated with more weight loss and not with worse psychological outcomes, and in the smart-scale cohort above, more than 72% of users had at least one stretch of 30 days or more without weighing, gaining 0.58 to 1.37 kg during those breaks depending on starting BMI. Nothing in the table above compensates for a month you did not step on the scale. A filter with nothing to filter reports nothing. The methods page lists all fifteen with the formula each one actually runs, and support will go through the arithmetic on your own log if a reading looks wrong.
Common questions
Which trend method should I use in Peptrend?
Robust Adaptive EWMA, which is what the app selects out of the box. Switch to Rolling Median if you have concrete reason to distrust the scale, to Kalman Filter if the weekly rate matters more to you than the weight, and to Weekly Average if you weigh in about twice a week. Everything else is worth reading about and not worth switching to.
How different are the trend methods, really?
On one user's real log — 84 weigh-ins over 225 days — the fifteen methods finish 4.0 lb apart, from HMA at 182.9 lb to KAMA at 187.0 lb. The five heavily damped ones in the middle finish within 0.5 lb of each other, on a log where the scale's mean day-to-day change is 1.16 lb.
What makes Robust Adaptive EWMA robust?
A residual further than 2.5 robust standard deviations from the prior trend has its smoothing constant scaled down by threshold ÷ residual, so the distance the line travels that day works out to alpha × threshold no matter how wrong the reading was. The scale estimate is a median absolute deviation over the last 14 residuals, times 1.4826, floored at 0.05 kg.
Does Peptrend ever change my trend method for me?
No. There is no automatic method selection, no per-user tuning and no machine learning anywhere in the app. The method you pick is the method that runs, and the parameters are the shipped defaults until you edit them yourself.
Sources
- Median absolute deviation — the 1.4826 consistency constant (Wikipedia)
- Huber loss — quadratic near zero, linear beyond the tuning constant (Wikipedia)
- Kaufman's Adaptive Moving Average — StockCharts ChartSchool
- Hyndman & Athanasopoulos, Forecasting: Principles and Practice (3rd ed.) — Simple exponential smoothing
- Vuorinen et al., Frequency of Self-Weighing and Weight Change: Cohort Study With 10,000 Smart Scale Users, JMIR (2021)
- Zheng et al., Self-weighing in weight management: a systematic literature review, Obesity 23(2):256–65 (2015)