
Why your weekly rate changes every day (the Kalman filter)
Because the Kalman method estimates your rate as part of its own state and updates it every day, where thirteen of the app's fifteen methods read a seven-day look-back off the line they just drew. It holds weight and velocity together and corrects both by 56% of each day's surprise. On one user's log that weekly figure averages 2.64 lb/week in size, with a standard deviation of 4.29.
What does the Kalman method actually estimate?
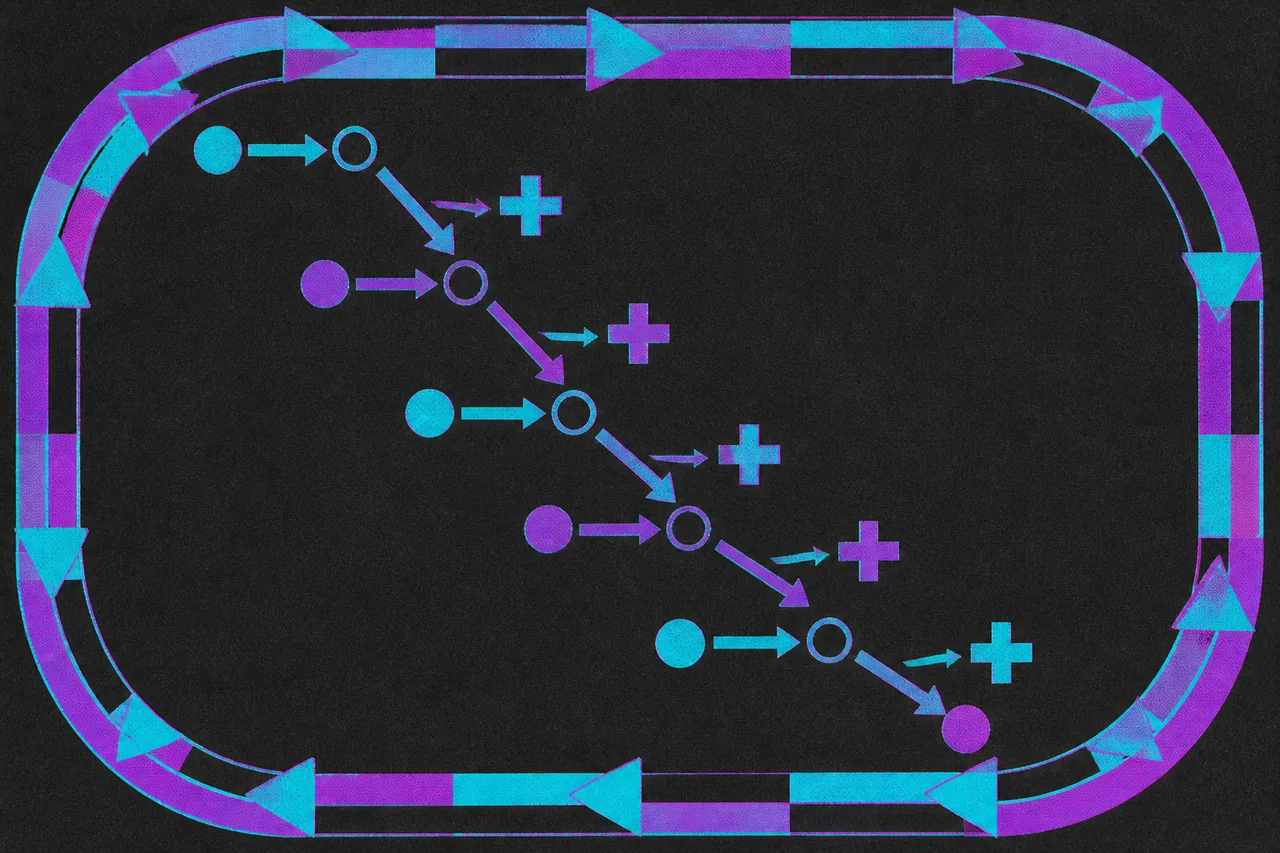
Its state is a pair of numbers: what you weigh, and how fast that is changing. Holt-Winters is the only other method carrying a slope of its own, and it never reports it; the rest track one number and work the rate out afterwards. This one carries both from day to day and updates both together.
The transition rule is the plainest arithmetic in the method. Tomorrow’s weight is today’s weight plus today’s rate. Tomorrow’s rate is today’s rate. That assumption — velocity holds until something tells you otherwise — is what gives the model its name in the literature: the constant-velocity model. In principle it also lets a filter coast through a week with no data, gliding at the slope it last believed in. Peptrend never gives it the chance: interpolation fills every missing day with a straight line before the filter runs.
Nothing ever measures the rate. The scale reports weight and only weight. Velocity is inferred entirely from the pattern of the filter’s own mistakes, which is the part that surprises people: a number you never observe, estimated from how wrong you keep being about a number you do.
R. E. Kalman published the recursion in 1960 in the Journal of Basic Engineering, volume 82, pages 35–45. Its first publicly known application was navigation — NASA Ames took it up in the early 1960s during feasibility studies for circumlunar guidance of the Apollo capsule, as Leonard McGee and Stanley Schmidt recount in NASA TM-86847.
How does the filter update each day?
The cycle is two steps, and Welch and Bishop’s UNC tutorial names them predict and correct. Predict: add velocity to the level, and inflate the uncertainty, because a day has passed and nothing has been checked. Correct: read the scale, take the difference between the reading and the prediction — the innovation — and move both states some fraction of the way toward it.
innovation = weigh-in − predicted weight
weight += k₀ × innovation
velocity += k₁ × innovation
Those two multipliers are the Kalman gain, and the filter recomputes them every day from its own error covariance. When the filter is uncertain about its prediction, the gain rises and the reading wins. When the reading is assumed noisy, the gain falls and the model wins. Welch and Bishop give the limit case: drive the measurement error covariance to zero and the gain goes to 1, at which point the filter is only redrawing the scale.
What do q and r mean, and can you change them?
The whole tuning is those two constants. Peptrend fixes q, the process noise, at 0.01, and r, the measurement noise, at 0.35, so the scale is treated as thirty-five times noisier in variance than your body is in a day. Their ratio decides where the gain ends up; their absolute size decides how long it takes to get there, because the filter starts every series with a covariance of 1. Double both, to q = 0.02 and r = 0.70, and the gain reaches the same 0.563 by day 44 instead of day 194.
Variances are hard to feel, so convert them. The series runs in kilograms, which makes r a standard deviation of √0.35 = 0.59 kg, or 1.30 lb of assumed scale error, against q’s √0.01 = 0.10 kg, or 0.22 lb of drift the body is allowed per day. Read as standard deviations rather than variances, the ratio shrinks to 5.9.
That 1.30 lb is a defensible guess. On one user’s log — 84 weigh-ins over 225 days — consecutive weigh-ins differ by 1.16 lb on average, with a standard deviation of 1.45 lb.
Both numbers are fixed. The parameter editor carries the SMA and WMA windows, the EWMA alpha, the rolling-median window and the whole Robust Adaptive EWMA block, and no control for q or r. There is no slider that makes this line calmer.
How much of each day’s surprise does the line take?
Run the covariance recursion forward at q = 0.01 and r = 0.35 and the weight gain climbs before it falls. It holds near 0.96 for months, then drops and settles.
| Day | Gain on weight (k₀) | Gain on velocity (k₁) |
|---|---|---|
| 1 | 0.852 | 0.424 |
| 10 | 0.941 | 0.878 |
| 50 | 0.961 | 0.921 |
| 100 | 0.954 | 0.907 |
| 150 | 0.910 | 0.821 |
| 200 | 0.564 | 0.257 |
| 226 | 0.563 | 0.256 |
Settled, the line takes 56.3% of every day’s surprise, where an EWMA at its default α = 0.10 takes 10%.
The slow convergence has a practical edge to it. Around day 50 the gain peaks at 0.961 and the line is passing almost the raw scale straight through. It does not fall below 0.57 until day 194, and then it holds at 0.563. Anyone switching to this method on a fresh install sees the twitchiest version of it first, then watches it change character without touching a setting.
Why does the weekly rate change every day?
Thirteen of the fifteen methods report trend[t] − trend[t−7], a seven-index look-back on the line they just drew, and Weekly Average differences its own weekly means. The Kalman method reports velocity × 7 — the state it has been maintaining all along. That is the payoff: the rate needs no seven-day history behind it, and it turns the day the data turns.
The bill arrives in variance. On this user’s log the model’s own velocity averages 2.64 lb/week in absolute size, with a standard deviation of 4.29 and readings running from −15.5 to +18.2 lb/week. Apply the ordinary seven-day look-back to the very same Kalman line and you get 1.15 lb/week with a standard deviation of 1.38. The two disagree about whether you are gaining or losing on 24% of days. On the log’s final day the model says −1.93 lb/week; the look-back on its own line says −2.72.
That number does not stay put, either. The energy-deficit card converts whatever weekly rate the trend point carries at its default 3,500 kcal per pound, so −2.72 lb/week prints as roughly a 1,360 kcal/day deficit and −1.93 as 965. Same data, same line, same day.
What does one bad weigh-in do to the line?
Feed a settled filter one day five pounds above the truth, then go back to clean readings.
| Days after the spike | Trend offset | Reported rate |
|---|---|---|
| 1 | +2.82 lb | +8.95 lb/week |
| 2 | +1.79 lb | +1.62 lb/week |
| 3 | +0.88 lb | −1.99 lb/week |
| 5 | −0.08 lb | −2.75 lb/week |
| 7 | −0.21 lb | −1.05 lb/week |
| 14 | +0.01 lb | +0.05 lb/week |
| 21 | 0.00 lb | 0.00 lb/week |
The velocity state is what makes the recovery ugly. One high reading persuades the model you are gaining at nine pounds a week, and four days of ordinary weigh-ins are needed to argue it back out of that belief, dipping 0.21 lb below the truth on the way. The line is back inside a twentieth of a pound by day ten and still ringing faintly at day fourteen. On day 50 of a fresh log, where the gain is 0.961, the same five-pound reading moves the line 4.80 lb and drives the printed rate to +32 lb/week.
Genuine changes get the same eagerness. A real 1 lb step is 92% absorbed by day two, overshoots to 15% past the true value on day four, and settles inside 1% by day nine.
On 84 real weigh-ins, the Kalman line ignores 5.5% of the scale
Nothing else in the app lets this much of the scale through. Line moves per day is the mean absolute day-to-day change in the trend line; ignored is the share of the scale’s own daily movement the line does not pass through.
| Method | Line moves/day | Scale movement ignored | Final reading |
|---|---|---|---|
| Weekly Average | 0.196 lb | 83.1% | 183.0 lb |
| LOESS | 0.074 lb | 82.8% | 184.7 lb |
| KAMA | 0.080 lb | 81.3% | 187.0 lb |
| Robust Adaptive EWMA (default) | 0.094 lb | 78.1% | 185.0 lb |
| EWMA | 0.103 lb | 75.9% | 184.5 lb |
| TEMA | 0.196 lb | 54.4% | 183.3 lb |
| HMA | 0.368 lb | 14.3% | 182.9 lb |
| Kalman Filter | 0.406 lb | 5.5% | 183.0 lb |
Its final reading, 183.0 lb, lands on the last raw weigh-in of 183.0. Hacker’s Diet finishes 3.0 lb above that same weigh-in. Across all fifteen methods on this one file the final readings span 4.0 lb — the ground signal-to-noise on your scale covers in detail.
The table hides one thing. The Kalman method interpolates unconditionally, and on that log it turns 84 weigh-ins into 226 daily values, so 142 of those 226 days were invented by straight-line fill — and the filter corrects against them with the same r = 0.35 it applies to a real weigh-in. What that does to a line is its own subject.
Is this a textbook Kalman filter?
The textbook measurement update is P = (I − KH)P⁻, with every entry on the right computed from the pre-update covariance. Peptrend writes the four entries in sequence, and the last two read the values the first two just overwrote:
p00 = (1 - k0) * p00
p01 = (1 - k0) * p01
p10 = p10 - k1 * p00 // p00 here is already the updated one
p11 = p11 - k1 * p01 // and so is p01
Two things follow, both measurable. The matrix stops being symmetric after the very first update — p01 lands at 0.148 while p10 lands at 0.874 — and because (1 − k₀) < 1 the subtraction takes away less than it should, so the covariance stays inflated and the filter keeps believing it knows less than it does. The textbook recursion settles at a gain of 0.456 inside a fortnight. This one settles at 0.563 after roughly two hundred, 23% more of every surprise, permanently.
Re-running the same 226-day series both ways: the shipping ordering moves 0.406 lb a day and finishes at 183.00 lb with a rate of −1.93 lb/week; the textbook ordering moves 0.273 lb a day and finishes at 183.08 lb at −1.83 lb/week. The line you see is about half again as lively as a canonical two-state filter on the same data would be. It converges and it is stable, but it should not be described as a canonical Kalman covariance update.
Should you use the Kalman method?
Pick it if you weigh in daily on one scale under conditions you control, and you want the rate to move the day your body does. Nothing else in the app gives you that; every other line makes you wait a week for the number beside it to agree.
Pick something else if any weigh-in might be a bad weigh-in. Ten days of ringing after one five-pound reading is a long time to distrust your own chart, and the rolling median exists for scales that lie. If the appeal is the adaptive gain rather than the velocity state, KAMA’s efficiency ratio reaches a similar idea from a far more conservative starting point, and the default already varies its own alpha while throttling outliers.
It lives in Advanced Mode, which is Pro, as is the trend chart it draws on. The app labels it “Powerful but technical” and files its cons as “Parameters are unintuitive” and “Outlier robustness requires variants” — accurate on both counts, given there are no controls for q and r at all. Start from what an EWMA does to a weigh-in if the vocabulary here was new, compare against the original Hacker’s Diet filter for the opposite temperament, and read the whole list on the methods page before you commit to a line.

Common questions
What is the Kalman filter trend method in Peptrend?
A two-state constant-velocity filter. It holds an estimate of your weight and an estimate of your weekly rate, predicts both forward one day, then corrects each in proportion to how far the day's weigh-in fell from the prediction. It is the only method whose rate comes from the model itself; thirteen of the other fourteen read a seven-day look-back off the line they just drew.
What do q and r mean in a Kalman weight filter?
They are the assumed variances of the process and of the measurement. Peptrend fixes them at q = 0.01 and r = 0.35, and because the series runs in kilograms that is a scale error of about 0.59 kg (1.30 lb) against a daily drift error of about 0.10 kg (0.22 lb). The ratio, 35, is what sets the settled gain; neither number has a slider.
Is the Kalman filter better than an EWMA for tracking weight?
It is faster and far less forgiving. Its settled gain of 0.563 takes 56% of each day's surprise where an EWMA at α = 0.10 takes 10%. On this user's log the Kalman line moves 0.406 lb a day against the EWMA's 0.103 and ignores 5.5% of the scale's daily movement against 75.9%.
Why does my weekly rate change every day?
On the Kalman method, because the rate is the model's own velocity multiplied by seven, updated every day. On this user's log that figure averages 2.64 lb/week in size, with a standard deviation of 4.29 and readings from −15.5 to +18.2 lb/week. The seven-day look-back applied to the same line averages 1.15 lb/week with a standard deviation of 1.38.
Sources
- Kalman, R.E. (1960) — A New Approach to Linear Filtering and Prediction Problems, Journal of Basic Engineering 82(1):35–45
- Welch, G. & Bishop, G. — An Introduction to the Kalman Filter, TR 95-041, UNC-Chapel Hill (PDF mirror)
- McGee, L.A. & Schmidt, S.F. — Discovery of the Kalman Filter as a Practical Tool for Aerospace and Industry, NASA TM-86847 (1985)
- Kalman filter — Wikipedia