
What one bad weigh-in does to your trend line (rolling median)
A rolling median mostly absorbs it; a moving average passes it on. Add one 10 lb error to one user's log and the 7-value median line shifts 0.4 lb, where the 7-value mean shifts 1.43 lb every time. Double the error and the mean's miss doubles; the median's does not, because a median reads only where the bad number sits in the sort. The price is a line that stands still on 47% of its steps.
Is your body moving, or is the scale wrong?
The first is signal you want smoothed. The second is a number you want left out of the arithmetic entirely, and a mean has no way to leave anything out.
Most of what a bathroom scale shows you is the body moving. On one user’s log — 84 weigh-ins over 225 days — the mean change from one weigh-in to the next is 1.16 lb against an underlying drift of 0.098 lb/day, so the daily noise runs 11.9 times the daily signal. An overnight gain is ordinary, and smoothing exists to see past it.
Then there is the other thing. A foot half on the frame, a scale that was moved onto carpet, a different scale in a hotel bathroom, a weigh-in typed in with a digit transposed. When researchers brought 61 home scales into a lab and tested them against NIST Class F calibration weights at 10, 25, 50, 75, 100 and 110 kg, the 43 digital ones showed no significant deviation at any load but 75 kg, and repeat rounds on the same scale differed by an average of 0.11 kg per 45.4 kg of load, ranging from nothing at all to 0.6 kg. The instrument on your floor is usually telling the truth. Its failures arrive one weigh-in at a time, and isolated events are what an average handles worst.
How many bad weigh-ins can a rolling median survive?
A statistic’s breakdown point is the smallest fraction of corrupted observations that can drag it arbitrarily far from the right answer. For the arithmetic mean that fraction is 1/n: one reading, wrong by enough, takes the average anywhere you like. For the median it is 50%, the highest any estimator can reach.
Peptrend’s Rolling Median runs the plainest version of that idea over a trailing window:
T_t = median(W_t, W_(t−1), … , W_(t−N+1))N is the rollingMedianWindow setting, default 7. Sort the last seven weigh-ins and take the fourth. Three of those seven can be wrong by any amount — 20 lb, 200 lb, it makes no difference — and the fourth value is still one of the four honest ones. The window is trailing, so the method is causal and safe to read today; it expands from your first weigh-in, so there is no warm-up gap at the start of a log, and it averages the two middle values whenever the count is even.
That threshold is the whole design. A median filter works as long as the window can be chosen so the number of corrupted entries in it stays below half. Cross that line and the guarantee is gone.
What does one bad weigh-in do to each filter?
Take this user’s log’s 84 weigh-ins, add 10 lb to exactly one of them, re-run each filter, and record how far the line moved at its worst. Then repeat at every position from the eighth weigh-in to the eighth from last — 70 of them, each with a full window on either side.
| Filter | Displacement from one +10 lb error | Same error, doubled to +20 lb |
|---|---|---|
| Rolling Median, 7 values | 0.40 lb typical, 1.20 lb at the 90th percentile | 0.40 lb typical, 1.20 lb at the 90th percentile |
| SMA, 7 values | 1.43 lb, at every position | 2.86 lb, at every position |
| EWMA, α = 0.10 | 1.40 lb typical, 3.87 lb at the 90th percentile | 2.80 lb typical, 7.75 lb at the 90th percentile |
The SMA row is arithmetic showing up on cue: a 7-value mean passes through error ÷ 7 wherever you put the damage, and doubling the error doubles what gets through. The EWMA row starts from the same theory — α = 0.10 passes through error × 0.10 — and its floor is exactly that, 1.00 lb. It runs higher because the app fills missing days before it smooths, so one bad weigh-in also poisons the days invented on either side of it. The worst placement, sitting on the weigh-in that ends this log’s longest gap, moved the line 8.02 lb.
The median row does not move. Doubling the error changed nothing, because a median reads only where the corrupted value falls in the sorted window, and 20 lb of error sits at the same end of that sort as 10 lb. In 17 of the 70 placements, 24% of them, the line did not shift by so much as a hundredth of a pound. The bad weigh-in landed in the window, got sorted to the outside, and vanished.
The median’s worst placement anywhere moved the line 1.60 lb, and that is the shape of the failure. With an odd window a median returns a number you actually recorded, so a nudge that changes its answer changes it to the next number you recorded along — a few tenths where the readings in the window sit close together, the whole distance where they are spread out or where the window straddles a real change in level.
Why the line looks like stairs: a median picks one of your weigh-ins
82 of the 84 rolling-median values on this user’s log are exactly equal to a weigh-in in the file. The line takes only 40 distinct values across those 84 points, and on 39 of its 83 steps — 47.0% — it does not move at all, with one flat run seven steps long. The 7-value SMA is flat on 4 steps out of 83.
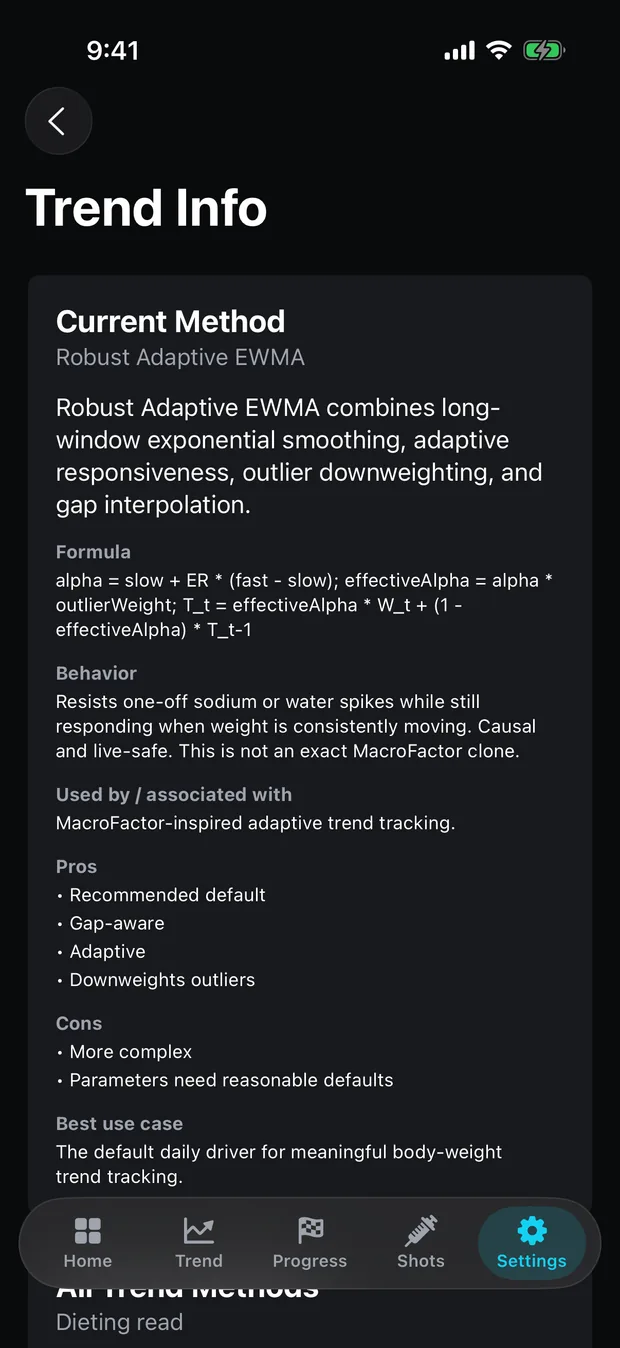
That is what a selector does. Tukey built the classic smoothers out of repeated running medians in Exploratory Data Analysis (1977), and R still ships them, splitting step included, to break up the horizontal stretches the medians leave behind. The full recipe then finishes with hanning, a weighted average of each point and the mean of its two neighbours, because neither medians nor splitting touch a monotone sequence. Peptrend runs the median alone. The steps stay in, and the app’s own explainer says so: under Cons it lists “Very laggy” and “Can look ugly and stepped”.
There is a smaller consequence with a sharp edge. This user’s log’s rolling median finishes at 185.0 lb, which is a real weigh-in from the file — while the last two readings on the scale are 184.4 and 183.0. A stepped line does not glide down to meet you.
Is it any different from a moving average? Not on most days
Over 225 days the rolling median and the 7-value simple moving average land within a hundredth of a pound of each other: 0.304 lb of movement per point against 0.295, and 73.9% of the scale’s daily movement ignored against 74.7%.
| Method | Line moves per point | Scale movement ignored | Final reading |
|---|---|---|---|
| SMA, 7 values | 0.295 lb | 74.7% | 184.7 lb |
| Rolling Median, 7 values | 0.304 lb | 73.9% | 185.0 lb |
| Hacker’s Diet (α 0.1, no interpolation) | 0.229 lb | 80.3% | 186.0 lb |
| EWMA (α 0.10) | 0.103 lb | 75.9% | 184.5 lb |
| Robust Adaptive EWMA (the default) | 0.094 lb | 78.1% | 185.0 lb |
Two filters with completely different failure behaviour, separated by nine thousandths of a pound. Robustness is a worst-case property, and a mean taken over 225 days cannot show it, because on almost all of those days nothing was wrong with the reading. The rolling median is also 3 times blockier than the EWMA on the same file, which is the visible half of the trade and the half people notice first.
The window holds seven weigh-ins, not seven days
Rolling Median never interpolates. Skipped days are simply absent from the series it smooths, so N = 7 means the last seven times you stood on the scale, however long that took.
On this user’s log the average gap between weigh-ins is 2.7 days, so a seven-value window spans 12 calendar days at the median and 16.1 on average, and 33 of its 78 full windows cover more than a fortnight. The rate printed beside the line inherits that stretch: for Rolling Median, as for most of the methods, the rate is a fixed seven-index look-back, trend[i] − trend[i−7], so on this log the “weekly” figure covers a median of 15 calendar days and more than 7 in 90% of cases. Interpolation changes the line sets out what the alternative does — a filled-in day is a made-up weigh-in, and a median handed made-up values has fewer real ones left to defend itself with.
When is a rolling median the right choice?
Reach for it when you have concrete reason to believe some of your numbers are wrong: a scale shared with a household, or a stretch of travel weigh-ins on unfamiliar equipment. The app’s own summary for the method is “Rolling Median barely reacts to outliers”, and its stated best use case is a defensive one, for when outliers are severe.
Robustness is not free, and the bill comes due on clean data. Against normally distributed noise the sample median carries an asymptotic efficiency of 2/π, about 64% — its estimate bounces around roughly 25% more than the mean’s from the same readings. The crossover sits at about 4.7 degrees of freedom in a Student t: with tails heavier than that the median wins, and with lighter tails you are paying for insurance against a claim you will not make.
The second cost is speed. A median does not move until enough of its window has turned over, so a real change in level — a different scale, a genuine regain — is read as a bad morning until four of the seven values sit on the far side of it. On this user’s log four weigh-ins span a median of five days, and because the window counts weigh-ins rather than days, a run of missed mornings stretches that wait further still. That is the behaviour you asked for, seen from the side you did not want.
For resistance without the staircase, the app’s default takes the other route. Robust Adaptive EWMA scales down a suspicious reading using a MAD estimate of recent residuals, and moves 0.094 lb per point while ignoring 78.1%; the plain exponential average underneath it is the shortest route to how that recurrence works. A Kalman filter uses a gain that decides how much of each new reading to believe. And if the aggregate numbers above made the median look like a moving average with extra steps, SMA versus EWMA covers what a rectangular window costs on its own terms.
Rolling Median is one of the four methods offered in Simple Mode, so it does not need Advanced Mode switched on, and from 1.4.0, coming soon, a fresh install has it on the method strip from the first launch. Editing the window is part of the trend parameter editor, which is Pro, as is the Weight Trend chart itself — the free tier gets the raw scale chart on the Scale tab. Whichever line you pick, the fifteen methods finish 4.0 lb apart on identical data. The methods page lists each one with the formula it actually runs.
Common questions
Will one bad weigh-in ruin my trend line?
Not if the line is a rolling median. Adding a single 10 lb error to one weigh-in in this user's log left the 7-value rolling median line completely unchanged in 17 of 70 placements, and moved it 0.4 lb at the typical placement. A 7-value simple moving average moved 1.43 lb every single time, because a mean divides the error by the window and keeps all of it.
What window size should a rolling median use?
Peptrend defaults to 7 values, and Pro's trend parameter editor takes the window anywhere from 3 to 31. A window of N tolerates floor((N−1)/2) bad readings, so 7 tolerates three and 11 tolerates five. Odd windows return an actual weigh-in; even ones average the two middle values. Wider windows absorb more damage and lag further behind.
Why does my rolling median line look like stairs?
Because a median selects one of the numbers in its window rather than blending them. On this user's log the rolling median took only 40 distinct values across 84 points and did not move at all on 39 of its 83 steps, with one flat run seven steps long.
Is a rolling median better than a moving average for tracking weight?
On aggregate movement the two are close, and the median is fractionally the busier: 0.304 lb per point against the SMA's 0.295, ignoring 73.9% of the scale's daily movement against 74.7%. The difference shows up only on the days a reading is wrong.
Sources
- Robust statistics — the breakdown point (Wikipedia)
- Median filter — impulse noise and the half-window condition (Wikipedia)
- R stats::smooth — Tukey's running median smoothers, after Tukey, Exploratory Data Analysis (1977)
- Jim Albert, A Course in Exploratory Data Analysis — Smoothing
- John D. Cook, Efficiency of median versus mean for Student t distributions
- Yorkin et al., Accuracy and consistency of weights provided by home bathroom scales, BMC Public Health (2013)