
What your trend does on days you skip a weigh-in (interpolation)
On a day you did not weigh, the app draws a straight line between your two nearest weigh-ins and hands it to the filter as a real reading. That is interpolation, and it ships on. Skipping treats consecutive weigh-ins as consecutive steps whatever the calendar says. Same alpha of 0.1: on one user's log, 84 weigh-ins over 225 days, the filled line ends at 184.5 lb and the skipped one at 186.0 lb.
What does the trend do on a day you did not weigh?
The interpolation setting decides whether the filter sees a number on days you never stepped on the scale. With it on, Peptrend walks your log in date order and inserts a straight-line value for every missing day between two real weigh-ins, so the smoother receives one value per calendar day. With it off, the series contains only the days you logged, and the filter treats them as consecutive steps no matter how much calendar sits between them.
It ships on. The toggle is labelled “Interpolation enabled” and sits in Trend Settings under Parameters, alongside the window and alpha controls, in the Pro section of that screen.
Two other rules apply before it and do not depend on it. Weigh-ins you have marked excluded are dropped. Several weigh-ins on the same calendar day are averaged into one value, while the day’s last raw reading is kept separately so the green dot on the chart still shows what the scale said.
On one user’s log — 84 weigh-ins over 225 days — turning interpolation on takes the series from 84 points to 226. That means 142 of the 226 values the filter reads, 63% of them, were manufactured by the app rather than measured by you.
How much does filling the gaps change the line? 1.5 lb, same alpha
Run the plain EWMA recurrence at α = 0.1 over that log both ways and the lines finish 184.5 lb filled against 186.0 lb skipped. Nothing else changed: same formula, same constant, same 84 readings.
Mid-log they get further apart than that. This user’s file goes 45 days without a weigh-in: 188.2 lb before the pause, 188.0 lb after it. The filled line drifts through those 44 manufactured days and stands at 188.0 lb when the real reading lands. The skipped line took a single step and stands at 189.8 lb. The two are 1.8 lb apart on that one day, wider than the 1.5 lb they finish at.
Neither is a measurement. The filled line asserts a month and a half of steadiness nobody observed. The skipped line treats that month and a half as one morning’s step. Across all 84 weigh-in days the two sit 0.96 lb apart on average, and 2.1 lb apart at their widest.
That difference is the whole distance between two of the app’s named methods. Hacker’s Diet hard-overrides the setting to off, plain EWMA follows it, and both run at alpha 0.1 by default. Choosing between those two names is a gap-policy choice under an algorithm’s label.
Which trend methods fill in missing days?
Two of the fifteen. The rest have the answer baked in, which is why switching method changes your gap policy whether you meant it to or not.
| Gap policy | Methods |
|---|---|
| Follows the Interpolation setting (on by default) | EWMA, Robust Adaptive EWMA |
| Always fills | DEMA, TEMA, HMA, KAMA, Kalman Filter, LOESS, Savitzky-Golay, Holt-Winters |
| Never fills | SMA, Linear WMA, Hacker’s Diet, Rolling Median |
| No daily series at all | Weekly Average (groups by calendar week) |
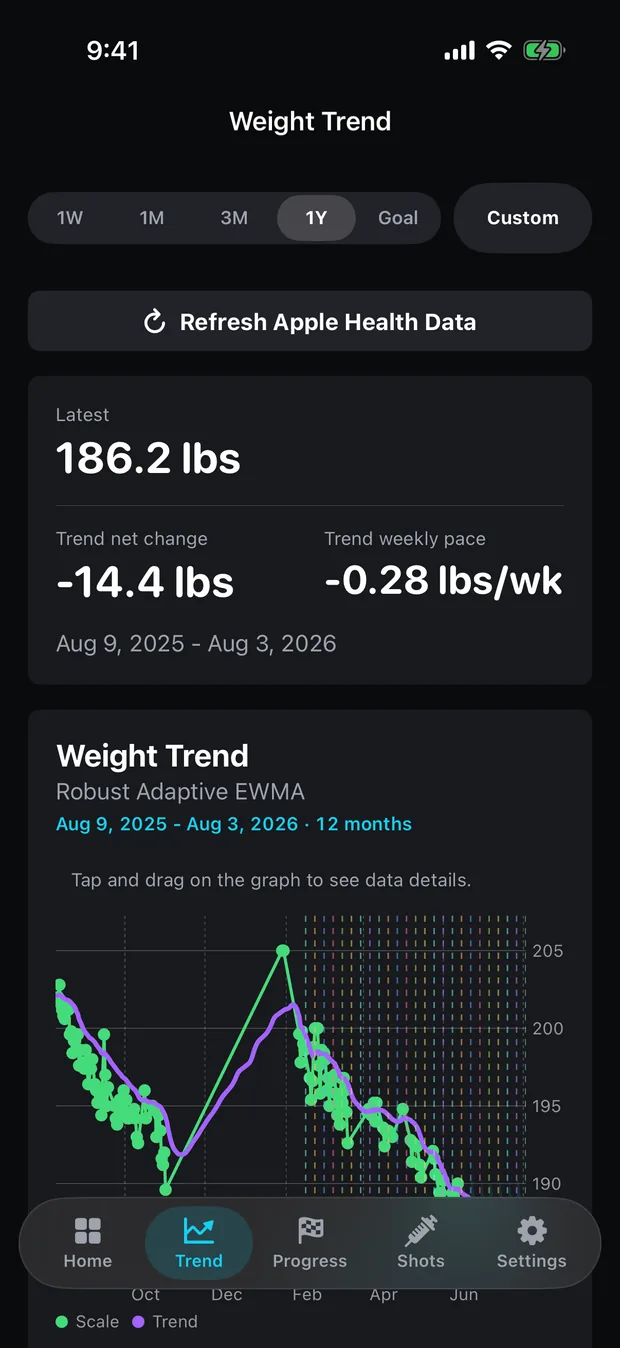
Robust Adaptive EWMA is the app’s default, so the toggle moves the line drawn on the Trend tab out of the box. On this user’s log it finishes at 185.0 lb with filling on and 188.0 lb with it off: 3.0 lb from one switch. That is a wider spread than plain EWMA showed, because the robust filter’s efficiency-ratio window and its outlier window are both counted in points, so dropping 142 points stretches both. The full method list gives each one’s parameters.
Does the weekly rate still cover seven days?
Almost every method derives its rate the same way: today’s trend value minus the trend value seven indices back, not seven days back. The two exceptions read a rate from their own machinery — Kalman from its velocity state, Weekly Average by differencing two calendar weeks. With interpolation on, one index is one day, so the look-back on this user’s log is exactly 7 calendar days at every point.
With interpolation off, the same seven indices span a mean of 18.9 calendar days on that log, a median of 15, and at worst 58. Nearly nine in ten of them cover more than a week. At the worst of them plain EWMA reports −1.3 lb across 58 calendar days, and the app still labels it per week.
Window parameters behave the same way. SMA never fills, so a window of 7 always means seven weigh-ins, and on a log this sparse those seven span about sixteen days. Read every window in the parameter editor as a count of points in whatever series the method was handed.
Why do a few long gaps matter this much?
Because the log covers 37.2% of the days in its own span, and the missing 63% are not spread evenly. Of the 83 intervals between consecutive weigh-ins, 56 (67%) are next-day pairs. The other 27 carry every missing day in the file. Across all 83 the mean interval is 2.71 days and the median is 1; the longest is 45.
Two thirds of that log looks like someone weighing daily. All the damage sits in the other third. On the app’s own year chart the gaps show up as straight green runs between distant dots.
Filling carries the standard cost of replacing a missing value with a single best guess: the imputed points vary less than real observations do, so the series looks steadier than the thing it came from. Stef van Buuren’s Flexible Imputation of Missing Data works through why single imputation understates variability. Weight data is already noisy enough to need filtering, and filling gaps removes some of the noise the filter exists to handle.
The setting only has room to work in the gaps you leave it, but the difference outlives them. The longest unbroken daily stretch in this user’s file is 11 consecutive days, and across those the two lines still sit 0.70 lb apart on average, carrying the divergence the earlier gaps opened.
Is there a third option besides filling and skipping?
Fill or skip are not the only options, and the forecasting literature worked this out decades ago. A reading taken three weeks after the last one should carry more weight than one taken the next morning, because more has genuinely happened in between. D. J. Wright’s 1986 extension of Holt’s method to data observed at irregular intervals lets the smoothing coefficient vary with the elapsed time; Tomáš Cipra and Tomáš Hanzák’s 2008 Kybernetika paper offers an alternative to Wright’s version and shows how to estimate its parameters.
Libra does this in a shipping weight tracker. Its support page publishes the formula: a seven-day smoothing time, with the step size computed from the actual millisecond gap between entries, which the page says adapts better to “larger intervals between entries”. Read it as documentation rather than as their source. As printed, the exponent carries no minus sign, and the behaviour the page describes needs one.
Peptrend’s switch is binary and does none of that. TrendWeight’s published math holds alpha at 0.1 and fills a missed Tuesday with the midpoint of Monday and Wednesday — the same rule Peptrend’s filled mode uses. The comparison between the two apps turns on rather more than gap handling, but this is one of the few places their arithmetic is identical.
Should you leave interpolation on or off?
Leave it on if you weigh most days. You get a line whose weekly numbers cover seven real days, and short gaps bridged by an assumption that is hard to get badly wrong across two or three days.
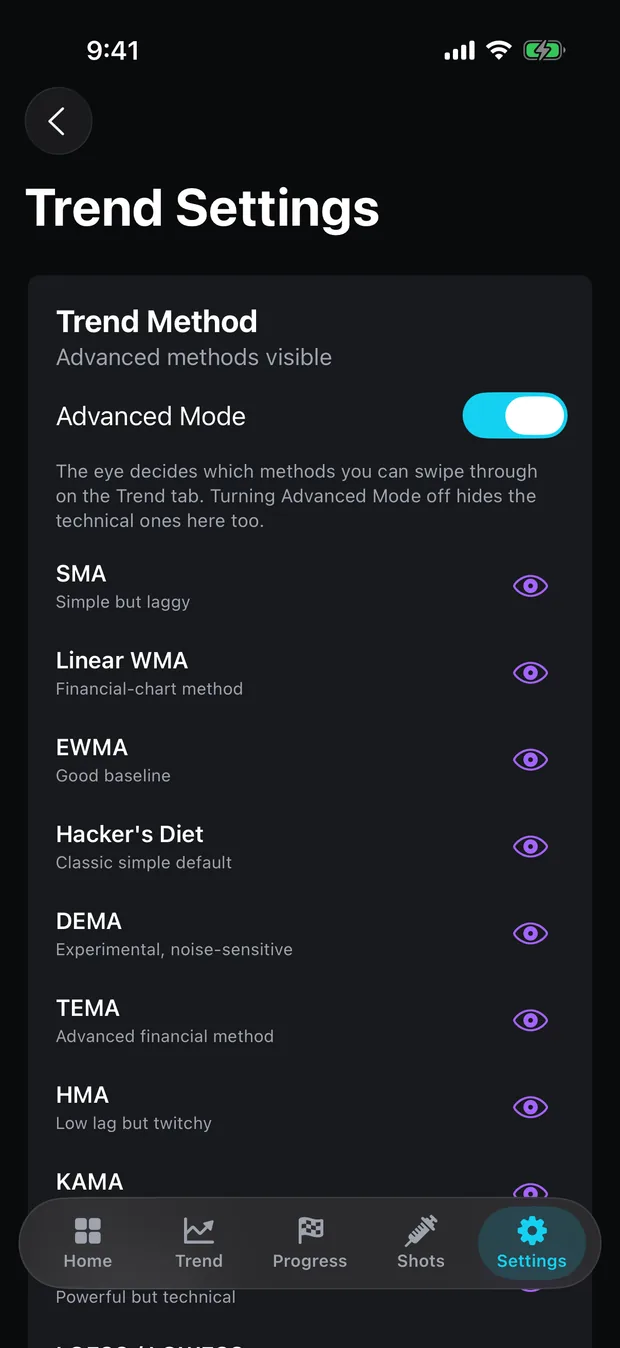
Turn it off if you weigh irregularly and would rather every point on the line trace back to a reading you took. Hacker’s Diet does it for you and sits in Simple Mode, so you can get the skipped-day convention without opening the parameter editor at all. From 1.4.0, coming soon, a fresh install starts it hidden from the method strip; the eye toggle in Settings shows it. Then read the rate figures as covering however many days those seven weigh-ins actually spanned.
The one thing worth avoiding is switching between them and comparing the numbers. A 3.0 lb move in the default trend line, with the same 84 readings underneath it, is larger than most of what people try to read off the chart week to week. Pick a convention, note which one you picked, and judge lag and responsiveness with it held fixed.
Common questions
Should I turn interpolation on or off for weight tracking?
Leave it on if you weigh most days and want the app's weekly-rate numbers to cover seven actual days. Turn it off, or pick Hacker's Diet, if you want a line whose every point comes from a reading you took. On this user's log the two settings put the default trend line 3.0 lb apart.
Which Peptrend trend methods fill in missing days?
EWMA and Robust Adaptive EWMA follow the global Interpolation setting, which ships on. DEMA, TEMA, HMA, KAMA, Kalman, LOESS, Savitzky-Golay and Holt-Winters always fill. SMA, Linear WMA, Hacker's Diet and Rolling Median never fill. Weekly Average never sees a daily series at all.
Does filling in the days I missed invent data?
Yes. The filled value is a straight line between your two real weights, and the filter reads it as though you had stood on the scale. On this user's log, 142 of the 226 daily points are manufactured that way — 63% of them.
Do I have to weigh in every day for the trend line to work?
No, but the gaps change what its numbers mean. With filling on, a missing day gets a straight-line value; with it off, the seven index steps behind the weekly rate span a mean of 18.9 calendar days on one user's log, and the app still labels that figure per week.
Sources
- The math of TrendWeight (linear interpolation for missed days, alpha = 0.1)
- Trend calculation in Libra (smoothing scaled by elapsed time)
- The Hacker's Diet — Signal and Noise (John Walker)
- Cipra & Hanzák, Exponential smoothing for irregular time series, Kybernetika 44(3), 2008
- Hanzák, Improved Holt Method for Irregular Time Series, WDS'08 Proceedings
- van Buuren, Flexible Imputation of Missing Data §1.3 — ad-hoc solutions