
Why one trend method sits 4 lb above the scale (Kaufman KAMA)
Because a filter can be damped hard enough to sit still while the scale moves. KAMA sets its smoothing constant from Kaufman's efficiency ratio, then squares it, so even a perfectly straight run gives an effective alpha near 0.048 — under half of plain EWMA's default. On one user's log it ignores 81.3% of the scale's daily movement, moves 0.080 lb a day, and ends at 187.0 lb.

What is Kaufman’s efficiency ratio? Net displacement over path length
Two measurements, one division. Add up the absolute size of every daily step over a window — that is the path length, the distance the scale claimed to travel. Then measure the straight-line gap between the first reading and the last — the displacement. Divide the second by the first:
ER = |W_t − W_(t−N)| / Σ |W_i − W_(i−1)|The answer lands between 0 and 1. Walk 2 lb down in ten steady steps and both terms equal 2 lb, so ER = 1. Wander 2 lb down and 2 lb back up and the displacement is zero against a path length of 4 lb, so ER = 0. Everything a real body does sits somewhere between.
Perry Kaufman published this in Smarter Trading (McGraw-Hill, 1995) as the input to an adaptive moving average. The argument was simple enough to state in a sentence: a fast average is the right tool when a series is going somewhere and a slow one is right when it is churning, so make the series declare which it is doing and slide between the two on every bar.
On a price chart the quantity gets called signal-to-noise. On a bathroom scale it asks something you can picture. Of all the pounds your scale moved this week and a half, what fraction of them went anywhere?
Why is KAMA slower than a plain EWMA? The alpha is squared
The efficiency ratio becomes a smoothing constant through a formula with a square on the end:
α = [ ER × (fast − slow) + slow ]²Peptrend’s constants are slow 0.04, fast 0.22, efficiency window 10 days. The blend inside the brackets therefore runs from 0.04 to 0.22, and the square knocks the top of that range down by a factor of four and a half, the bottom by twenty-five. Here is what that means for how long one weigh-in stays in the line:
| Efficiency ratio | Effective α | Half-life of one weigh-in | 95% of a step absorbed in |
|---|---|---|---|
| 0.00 — pure round trip | 0.0016 | 433 days | 1,871 days |
| 0.46 — this log’s median | 0.0151 | 45 days | 197 days |
| 1.00 — perfectly straight | 0.0484 | 14 days | 60 days |
| EWMA at α = 0.1, for reference | 0.1000 | 6.6 days | 28 days |
Read the bottom two rows together. KAMA at full enthusiasm — a straight, unbroken run, the most directional signal the ratio can report — still moves less than half as fast as plain EWMA at its default α does on an ordinary Tuesday. The ceiling of the adaptive method sits below the floor of the fixed one.
Kaufman’s published smoothing constant carries that square, and so do the standard reference implementations, which set fast to a 2-period EMA constant, 2/(2+1) = 0.667, and slow to a 30-period one, 2/(30+1) = 0.0645. Squared, textbook KAMA ranges from 0.0042 to 0.444. Peptrend’s 0.04 and 0.22 square to 0.0016 and 0.0484 — roughly a ninth as responsive at the top of the range.
On days you skip, the ratio mostly reads the interpolator
One user’s log — 84 weigh-ins over 225 days — produces 216 full efficiency-ratio windows. Their median is 0.46 and their mean 0.51, which sounds like a body moving with some purpose. It is not. 62 of those 216 windows score exactly 1.0, and every single one of them contains at least one interpolated day.
KAMA always fills missing days by straight linear interpolation between the two weigh-ins either side, regardless of the global interpolation setting. A straight line is the definition of a perfectly efficient path: every step the same size, every step the same direction. Feed a ten-day window that sits inside a gap and the ratio returns 1.0 by construction, because the interpolator drew the data that way.
Only two of the 216 windows consist of eleven consecutive real weigh-ins, which is too few to say anything about what the ratio reads on days you actually stood on the scale.
This is not a rare configuration. In a cohort of 9,768 smart-scale users followed for a mean 1,085 days, the median user stepped on the scale 2.80 times a week. In this user’s file, 142 of the 226 daily points KAMA reads — 63% — were never measured. Interpolation changes the line everywhere, but this is the one method where it changes the line’s own idea of how fast to move.
How much of the scale does KAMA ignore? 81.3% of daily movement
On the same 84 weigh-ins, at the app’s shipped parameters, here is where it lands:
| Method | Line moves/day | Scale movement ignored | Final reading |
|---|---|---|---|
| LOESS | 0.074 lb | 82.8% | 184.7 lb |
| KAMA | 0.080 lb | 81.3% | 187.0 lb |
| Hacker’s Diet | 0.229 lb | 80.3% | 186.0 lb |
| Robust Adaptive EWMA (default) | 0.094 lb | 78.1% | 185.0 lb |
| EWMA | 0.103 lb | 75.9% | 184.5 lb |
| HMA | 0.368 lb | 14.3% | 182.9 lb |
Two methods reject more of the scale’s daily movement than KAMA — LOESS, which is symmetric and reads future points to do it, and Weekly Average, which draws one point a week and cannot tell you anything about today. LOESS’s line moves a shade less as well. Among the methods that run forward day by day, nothing damps harder than KAMA. Those two columns are two views of one number. The final column is where the cost shows: KAMA finishes at 187.0 lb against a last weigh-in of 183.0 lb, the highest reading of any method on the file.
What does one 5 lb bad morning do to the line?
Cap the α at 0.0484 and you cap the damage from any single reading at 4.84% of the gap between that reading and the line. The largest one-day swing in this user’s log is 5.4 lb, which can move the KAMA line by at most 0.26 lb — and usually much less, because the spike also lands in the denominator of the efficiency ratio. A jump that reverses the next morning adds twice to the path length and nothing to the displacement, so the ratio falls, α falls with it, and the filter slows down precisely when it is being lied to.
That is a genuinely elegant property, and the reason KAMA earns a place in the app despite the lag it buys. It gets its outlier resistance for free, out of the same quantity it uses for speed, with no median filter and no threshold anywhere. Signal to noise on your scale works through what the daily noise is actually made of.
Why will the line not move when your weight really changes?
A filter that cannot be moved by a bad weigh-in cannot be moved by a good one. At the median efficiency ratio on this user’s log, KAMA needs 197 days to absorb 95% of a genuine step change in your weight. That is not a lag figure you can wait out inside a twelve-week cut.
The 187.0 lb final reading is the same fact stated as a number. Over 225 days the log falls 22.0 lb and finishes at 183.0 lb, and KAMA still holds the line 4.0 lb above that last measurement, because the closing stretch of the descent was not efficient enough to earn a faster α. If you switch methods after a discouraging fortnight, KAMA is the one that will tell you nothing has happened yet — and it will keep saying that for weeks after something has.
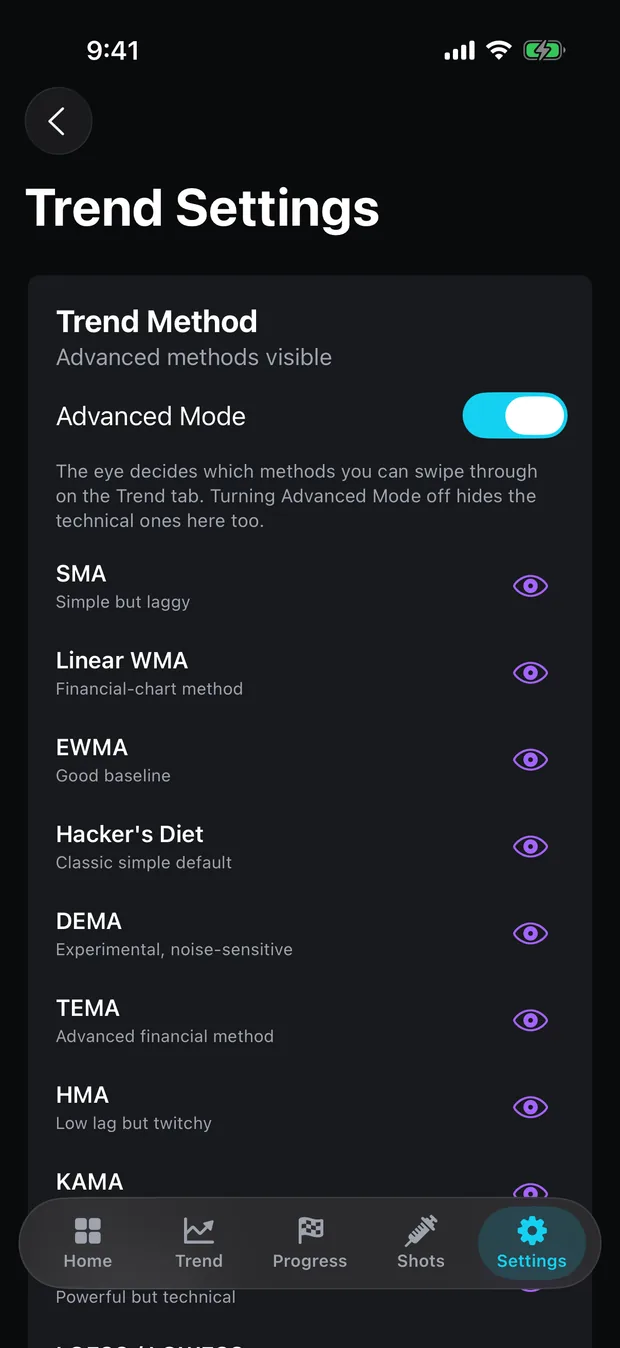
You cannot tune your way out of it either. The trend parameter editor covers the SMA and WMA windows, the EWMA alpha, the rolling-median window and all five Robust Adaptive EWMA settings, and it offers no control for KAMA’s slow alpha, fast alpha or efficiency window: the 0.04 / 0.22 / 10 the app ships with is what you get. The editor is Pro in any case, as are Advanced Mode and the trend chart itself. Because of the square, a fast constant of 0.30 would lift the α ceiling from 0.048 to 0.090 and nearly double the top speed — and no slider in the app asks for it.
How is the default method different from KAMA?
Robust Adaptive EWMA, the method the app selects out of the box, computes the same efficiency ratio and then does three things differently. It uses a 14-day window instead of 10. It applies the blend directly, with no square, so ER = 1 gives α = 0.22 and a half-life of 2.8 days rather than 14. And it adds a MAD-based outlier down-weight — a reading further than 2.5 robust standard deviations from the prior trend has its α scaled down in proportion — which does explicitly what KAMA gets as a side effect.
The result is the difference between 78.1% and 81.3% of daily movement ignored, and between 0.094 and 0.080 lb of line movement a day. Both are heavily damped filters. One of them can still change its mind in a week.
Kaufman’s ratio was built for markets, where a straight run is rare and worth chasing hard. A weigh-in log inverts both halves of that: the drift is real and persistent, and the straight runs the ratio finds are mostly the ones the app’s own interpolator drew. Bodyweight is a time series covers where the trading-chart parallel holds and where it snaps, and DEMA and TEMA sit at the opposite end of the same tradeoff. All fifteen methods are documented with their formulas and shipped parameters on the methods page. If a reading on your own log looks wrong, support will go through the arithmetic with you.
Common questions
What is Kaufman's efficiency ratio?
Net displacement divided by total path length over the last N periods. Perry Kaufman published it in Smarter Trading (McGraw-Hill, 1995). A series that walked 2 lb down in ten steady steps scores 1.0; one that went 2 lb down and 2 lb back up scores 0.
Why is KAMA's alpha squared?
Because the square is in Kaufman's published smoothing constant: SC = [ER × (fast − slow) + slow]². Peptrend keeps it. With the app's fast constant of 0.22, a perfectly efficient move yields an effective alpha of 0.22² ≈ 0.048, less than half of plain EWMA's flat 0.1.
Why does my trend line read higher than the scale?
Because a heavily damped method concedes a change slowly. Of the methods that run forward day by day, nothing in the app damps harder than KAMA: on one user's log it ignores 81.3% of the scale's daily movement and moves 0.080 lb a day, and it finishes 4.0 lb above the final weigh-in — the highest reading of the fifteen methods.
Does the efficiency ratio still work on days I did not weigh?
It reads them, but what it reads is the interpolator. KAMA always fills missing days by straight linear interpolation, and a straight line has an efficiency ratio of exactly 1. On this user's log, 62 of 216 windows score a perfect 1.0 and every one of them contains at least one filled-in day.
Sources
- Kaufman's Adaptive Moving Average (KAMA) — StockCharts ChartSchool
- Kaufman, Perry J. — Smarter Trading: Improving Performance in Changing Markets, McGraw-Hill, 1995 (Open Library record)
- Smarter Trading — Internet Archive lending copy
- Kaufman Efficiency Ratio — LuxAlgo indicator library
- Vuorinen et al., Frequency of Self-Weighing and Weight Change: Cohort Study With 10,000 Smart Scale Users, JMIR (2021)