
Why your trend line follows every weigh-in (Hull moving average)
It follows every weigh-in because Alan Hull's 2005 filter subtracts its own lag until the line leads: at the default 7-day window the centre of mass sits a third of a day ahead of today, and the heaviest weight in the kernel lands on yesterday. On one user's log — 84 weigh-ins over 225 days — HMA ignores 14.3% of the scale's daily movement and finishes at 182.9 lb.
Alan Hull set out in 2005 to build a moving average with almost no lag, and he got what he asked for. His own site claims a “near perfect balance between lag reduction and curve smoothing”, and on a price chart that is fair. Point the same filter at a bathroom scale and it draws the lowest line of the fifteen methods Peptrend offers, and the second busiest. On one user’s log — 84 weigh-ins over 225 days — HMA passes 85.7% of the scale’s own daily movement straight through into the trend.
How does the Hull moving average work?
HMA runs a weighted moving average three times and subtracts one pass from another. Hull writes it
as Integer(SquareRoot(Period)) WMA [2 x Integer(Period/2) WMA(Price) – Period WMA(Price)]. In
Peptrend that becomes four lines:
let half = WMA(values, window: max(1, n / 2))
let full = WMA(values, window: n)
let diff = zip(half, full).map { 2 * $0 - $1 }
let trend = WMA(diff, window: max(1, Int(Double(n).squareRoot())))
n is the wmaWindow setting, default 7, the same stepper that drives Linear WMA. Both divisions
truncate, matching Hull’s Integer() notation, so at the default the inner windows are 3 and 7 days
and the outer smoothing pass is 2 days long. StockCharts’ write-up rounds the square root to the
nearest whole number instead, which would give 3 — a small divergence worth knowing about if you
compare Peptrend’s line against a charting package.
The lag cancels by arithmetic you can do in your head. A linear WMA over n days trails the data by
(n−1)/3 days, so WMA(3) sits 0.67 days behind and WMA(7) sits 2 days behind. Double the fast one,
subtract the slow one, and the trailing distance becomes 2 × 0.67 − 2 = −0.67 days. The outer 2-day
pass adds 0.33 days back. Net: the line’s centre of mass sits a third of a day ahead of
today’s weigh-in.
Why does yesterday’s weigh-in count more than today’s?
Every linear filter is a weighted sum of past readings, and HMA’s weights are strange. At n = 7:
| Age of the weigh-in | HMA weight (n = 7) | Linear WMA weight (7) | EWMA weight (α = 0.1) |
|---|---|---|---|
| today | 0.500 | 0.250 | 0.100 |
| 1 day ago | 0.552 | 0.214 | 0.090 |
| 2 days ago | 0.254 | 0.179 | 0.081 |
| 3 days ago | −0.044 | 0.143 | 0.073 |
| 4 days ago | −0.119 | 0.107 | 0.066 |
| 5 days ago | −0.083 | 0.071 | 0.059 |
| 6 days ago | −0.048 | 0.036 | 0.053 |
| 7 days ago | −0.012 | 0 | 0.048 |
The heaviest weight in the whole kernel lands on yesterday, not today. Your last three weigh-ins carry a combined 1.306, and days 3 through 7 carry −0.306 to bring the total back to 1. Subtracting a slow average from a fast one is what buys the lead, and negative weights on the older readings are the bill. DEMA and TEMA pay the same bill in a gentler currency: their negative tails sum to −0.12 and −0.20, spread over weeks rather than crammed into five days. The mechanism is laid out in full alongside Mulloy’s formulas.
Why does the line lead the scale instead of lagging it?
Set the four filters side by side and HMA is the only one that does not trail.
| Filter | Centre of mass |
|---|---|
| EWMA, α = 0.1 | 9 days behind |
| SMA, 7-day window | 3 days behind |
| Linear WMA, 7-day window | 2 days behind |
| HMA, n = 7 | 0.33 days ahead |
Feed it a clean 1 lb step from a settled line and it covers half the move the same day, crosses the true value on day 1, peaks at 1.306 lb on day 2, and is back inside 1% by day 7. That is 31% overshoot in 48 hours. DEMA overshoots by 12% and takes 18 days to get there; TEMA by 18% over 12 days. HMA does the whole cycle inside a week, so a travel weekend or a sodium load is answered and overanswered before you have finished noticing it. Why lag exists at all, and what it costs to remove, is the subject of SMA versus EWMA.
One bad reading behaves the same way. A weigh-in 5 lb above the line moves an EWMA at α = 0.1 by 0.50 lb, DEMA by 0.95 lb, TEMA by 1.36 lb. It moves HMA by 2.50 lb on the day it lands and 2.76 lb the day after, then drags the line 0.60 lb below where it should be four days later. This user’s log has a largest single-day swing of 5.4 lb.
Why does a weekly weight cycle look bigger than it is?
At a 7-day period HMA’s gain is 1.23, so a weekly rhythm leaves the filter 23% taller than it arrived. Feed a filter a clean sine wave and compare the height of what comes out with what went in: below 1 it shrinks that rhythm, above 1 it enlarges it. HMA at n = 7:
| Cycle length | HMA (n = 7) | Linear WMA (7) | SMA (7) | EWMA (α = 0.1) |
|---|---|---|---|---|
| 2 days | 0.18 | 0.14 | 0.14 | 0.05 |
| 7 days | 1.23 | 0.29 | 0.00 | 0.12 |
| 14 days | 1.29 | 0.73 | 0.64 | 0.23 |
| 30 days | 1.10 | 0.94 | 0.91 | 0.45 |
This resolves the contradiction in the app’s own method card, which lists “Smooth-looking” as a pro and “Can be twitchy” as a con. Both are true. HMA kills day-to-day alternation nearly as well as a 7-day SMA does, which is why the curve has no jagged kinks in it. A 7-day SMA, at the period that matters most on a scale, has a gain of exactly zero.
Body weight has a documented weekly rhythm. Turicchi and colleagues, tracking a European weight-loss maintenance cohort in PLOS ONE in 2020, found weight highest on Monday and lowest on Friday, with an overall weekly fluctuation of roughly 0.35% of body weight. At this user’s log’s closing 183.0 lb that is about 0.64 lb of pure calendar artefact, and a filter with a gain of 1.23 renders it larger than it actually is. The physiology behind the cycle is covered in what an overnight gain is actually made of.
What does HMA do to 84 real weigh-ins?
| Method | Line moves/day | Scale movement ignored | Final reading |
|---|---|---|---|
| Kalman Filter | 0.406 lb | 5.5% | 183.0 lb |
| HMA | 0.368 lb | 14.3% | 182.9 lb |
| TEMA | 0.196 lb | 54.4% | 183.3 lb |
| Linear WMA | 0.345 lb | 70.4% | 184.3 lb |
| EWMA | 0.103 lb | 75.9% | 184.5 lb |
| Robust Adaptive EWMA (default) | 0.094 lb | 78.1% | 185.0 lb |
| Hacker’s Diet | 0.229 lb | 80.3% | 186.0 lb |
HMA comes second on both counts, and to the same filter. The Kalman method moves 0.406 lb a day against HMA’s 0.368, and rejects 5.5% of the scale’s movement against HMA’s 14.3%. Those two are the only lines in the app that barely filter at all. HMA’s final reading of 182.9 lb anchors the low end of a 4.0 lb spread across the fifteen methods, with KAMA at 187.0 lb at the top. Same 84 weigh-ins, four pounds apart.
That gap is lag showing up as a number. This user’s log ends on a descent, and a filter whose weights lean into the future has already spent a fall the trailing filters are still absorbing. If the descent holds, HMA was right first; if next week bounces, it was wrong loudest. On that log the daily noise runs about 11.9 times the underlying drift of 0.098 lb/day, a ratio worked out here.
What happens if you widen the window?
Raise wmaWindow in the trend parameter editor, anywhere from 3 to 30, and the whole kernel
stretches:
| WMA window | Outer pass | Weight on today | Heaviest weight lands on | Centre of mass | Peak step overshoot |
|---|---|---|---|---|---|
| 3 | 1 day | 1.500 | today | 0.67 days ahead | +50%, same day |
| 7 (default) | 2 days | 0.500 | yesterday | 0.33 days ahead | +31%, day 2 |
| 14 | 3 days | 0.183 | 2 days back | 0.33 days behind | +26%, day 6 |
| 21 | 4 days | 0.109 | 2 days back | 0.33 days behind | +29%, day 9 |
| 30 | 5 days | 0.062 | 3 days back | 1.00 day behind | +27%, day 14 |
At n = 3 the weight on today’s weigh-in is 1.500: the line moves a pound and a half for every pound the scale moves. Push out to 14 and the lead turns into a small trail, and the weight on any single reading drops below a fifth. What never goes away is the overshoot: half the step at n = 3, and still 26% to 31% everywhere from 7 to 30. Widening the window only moves the bump later.
HMA also interpolates unconditionally. Skip three days and it is handed a straight line drawn between the weigh-ins either side, which is a different choice from Hacker’s Diet and changes the answer more than most people expect — interpolation changes the line has the comparison.
When is the Hull moving average worth using?
It has one real merit on a scale: it is causal. HMA reads only past weigh-ins, so today’s point is final and will not be redrawn tomorrow. LOESS and Savitzky-Golay both look forward, which makes them unsafe for reading today’s value; HMA does not. Peptrend’s own method card is honest about the rest, listing “Not a recommended default” among the cons and “Advanced visual experimentation” as the best use case.
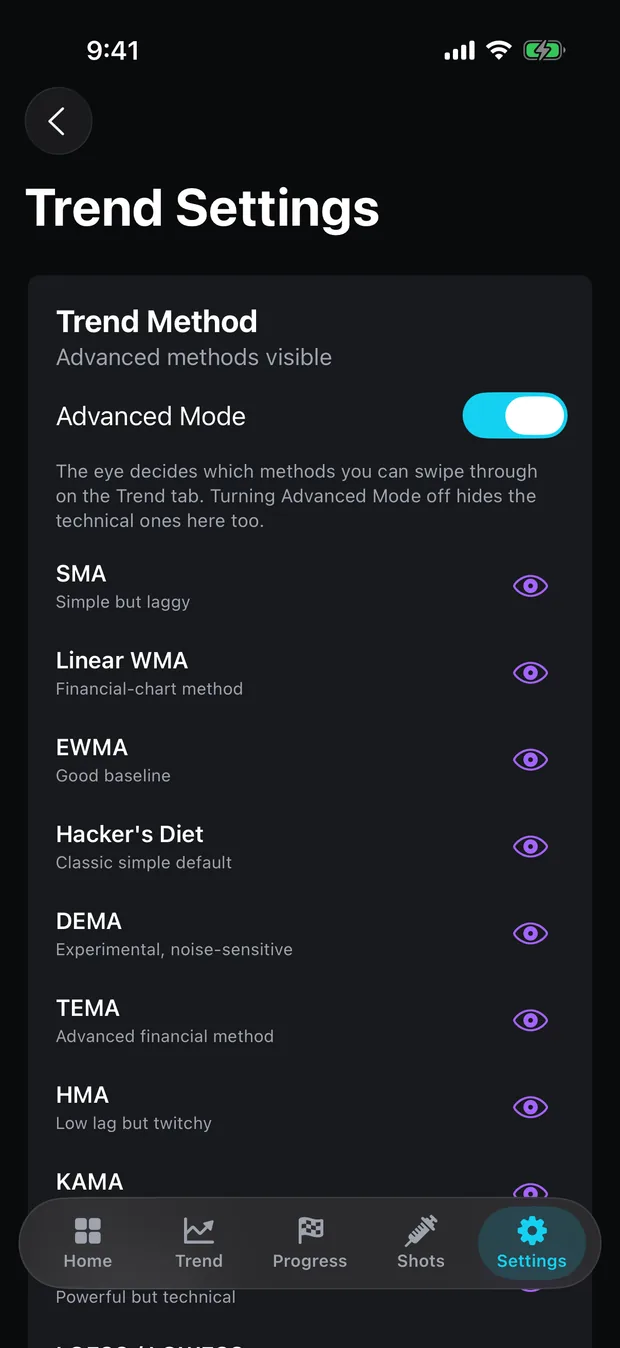
For a fast line with a reason for its speed, the Kalman filter tracks level and velocity as two states and sets its own gain per reading, which is a defensible way to be quick — though on this log it comes out quicker than HMA, passing 94.5% of the scale straight through. For rejection, the default Robust Adaptive EWMA throws away 78.1% of the daily movement and moves 0.094 lb a day. HMA sits behind Advanced Mode with the rest of the trading-chart imports, so it needs Pro, as does the trend chart it draws on.
All fifteen methods, with the assumption each one makes about your scale, are on the methods page, and choosing a trend method walks through picking one you can live with.
Common questions
Is the Hull moving average good for tracking body weight?
Rarely. On one user's log — 84 weigh-ins over 225 days — HMA ignores only 14.3% of the scale's own daily movement and moves its line 0.368 lb a day. Only the Kalman filter passes more through or moves more. On a series where daily noise runs about 11.9 times the underlying drift, that means most of the line's movement is noise.
Who invented the Hull moving average?
Alan Hull, an Australian trader, in 2005. By his own account he was working on a new indicator and got sidetracked by the lag problem. He writes the formula as Integer(SquareRoot(Period)) WMA [2 x Integer(Period/2) WMA(Price) – Period WMA(Price)].
Why does my HMA line sit below every other trend line?
Because HMA's weights lean forward. At a 7-day window the weights on your last three weigh-ins sum to 1.31 and the weights on days 3 through 7 sum to −0.31, putting the line's centre of mass a third of a day in the future. At the end of a downtrend a leading line reads low: 182.9 lb on this user's log against Hacker's Diet's 186.0 lb.
What window does Peptrend use for HMA?
The `wmaWindow` setting, default 7, shared with Linear WMA and adjustable from 3 to 30 in the trend parameter editor. The inner half-window and the outer square-root window are both derived from it and both truncated, so at n = 7 they come out as 3 days and 2 days.