
Why the scale hasn't moved in 2 weeks: the signal-to-noise maths
Two weeks is too short: a fortnight of real change is about the size of one ordinary morning's wobble. On one user's log — 84 weigh-ins over 225 days — day-over-day movement of 1.16 lb sits on a drift of 0.098 lb/day, a ratio of 11.9 to 1. At that ratio a fitted rate needs 18 days of daily weigh-ins before its two-standard-error band clears zero, and comparing two single mornings needs 30.

How do you work out your own signal-to-noise ratio?
Your noise-to-signal ratio is the average size of a day-over-day change divided by the average daily drift, and both numbers are already sitting in your log.
Work it on one user’s log — 84 weigh-ins over 225 days, net change −22.0 lb:
drift = 22.0 lb ÷ 225 days = 0.098 lb/day
noise = mean |change| between
consecutive weigh-ins = 1.16 lb
ratio = 1.16 ÷ 0.098 = 11.9
Call it 12 to 1. Both halves are magnitudes, so the ratio carries no sign; it says the typical morning-to-morning move is twelve times larger than the daily change you are trying to read.
John Walker made the same point without the arithmetic in the “Signal and Noise” chapter of The Hacker’s Diet (fourth edition, 2005): about 13.5 lb of food, air and water moves through you every day, almost eighty times the weight a dieter loses in that day. His figure counts the whole throughput; the 11.9 counts what is left of it by the next morning’s reading. That second number is the one you can compute from your own file, and how long you then have to wait is not something anyone can tell you in general.
How big is an ordinary day-to-day swing?
The standard deviation of the day-over-day change in that log is 1.45 lb, and the four other summary numbers you can pull out of the file agree with it.
Here they are: mean absolute change 1.16 lb, median 1.2 lb, 90th percentile 2.2 lb, largest single-day swing 5.4 lb. Now check them against what a normal distribution with SD 1.45 would produce.
| Statistic | Gaussian prediction at SD 1.45 | This log |
|---|---|---|
| Mean absolute change | 0.798 × 1.45 = 1.16 lb | 1.16 lb |
| Median absolute change | 0.674 × 1.45 = 0.98 lb | 1.2 lb |
| 90th percentile | 1.645 × 1.45 = 2.39 lb | 2.2 lb |
| Largest observed | — | 5.4 lb (3.7 SD) |
The mean matches its prediction to a hundredth of a pound, the median lands a fifth of a pound above, and the 90th percentile falls 8% short. Only the far end runs heavy: 83 draws from a normal curve throw up a 3.7 SD morning about one time in sixty, and this log has one. Nothing else in the file is being dragged by that morning, so the SD is a fair summary of the spread.
Invert the quantiles and you get a scale estimate that ignores the tail entirely. The median of 1.2 lb implies 1.2 ÷ 0.674 = 1.78 lb; the 90th percentile of 2.2 lb implies 2.2 ÷ 1.645 = 1.34 lb. The two land either side of the 1.45 SD. That first conversion factor, 1/0.674 = 1.4826, is the standard median-absolute-deviation constant, and it is the same one the app’s default Robust Adaptive EWMA uses to size its outlier threshold before down-weighting a weigh-in at k = 2.5 sigma. A rolling median throws the worst morning away outright.
How much noise is on a single weigh-in? The change divided by √2
The number you actually need is the noise on a single weigh-in, and it is smaller than the day-over-day figure by a factor of √2.
Write each weigh-in as trend plus error: w_t = trend_t + e_t. The difference between two of them is Δ = drift + (e_t − e_{t−1}), and two independent errors subtracted give a variance twice as large as one. So:
σ(single weigh-in) = σ(change) ÷ √2
= 1.45 ÷ 1.414 = 1.03 lb (from the SD)
= 1.78 ÷ 1.414 = 1.26 lb (from the median)
Which gives a rule you can apply in your head: your per-weigh-in noise is roughly your median day-over-day change. In this file that is 1.2 lb against a true value somewhere between 1.03 and 1.26.
For scale, 1.45 lb is 0.71% of the 205.0 lb high in that file and 0.79% of the 183.0 lb low. Schneditz and colleagues published 9,521 days of morning weights from one healthy adult, taken under a fixed protocol — fasted, voided, undressed — and measured the one-day relative difference at an SD of 0.53%, rising to 0.69% over a seven-day interval. That sits about 30% below this file’s figure. Neither dataset can tell you how much of the gap the protocol explains and how much is the two people, but the protocol costs nothing to copy.
How long before two weigh-ins can be compared? 30 days
Comparing today’s number to one single number from the past is the worst way to read your progress, and the arithmetic puts a figure on how bad.
The difference between two weigh-ins n days apart carries the drift plus two errors, so its noise is √2 × 1.03 = 1.45 lb — the day-over-day SD again, unchanged by how far apart the two mornings are. For that difference to sit two standard errors clear of zero:
0.098 × n > 2 × 1.45
n > 29.6 → 30 days
Four weeks. And the intermediate figure is worse than it looks: twelve days in, the real change is 12 × 0.098 = 1.2 lb, which is precisely the median overnight wobble. A fortnight of genuine progress at this rate is the same size as one ordinary Tuesday.
That is why 30 of 83 intervals in the log (36%) were gains across a stretch that lost 22 lb. An independent-noise model predicts about 43% up-intervals at the file’s mean gap of 2.7 days, so the real series goes the right way more often than pure noise would — a heavy morning is usually given back rather than kept. Why your weight jumps overnight covers where the water goes.
How much does fitting a slope save? 18 days instead of 30
Use every point in the window instead of two, and the wait drops from 30 days to 18.
Two ways to spend the extra data. Compare two seven-day means: the standard error of each is 1.03/√7 = 0.389 lb, their difference carries 0.550 lb, and 2 × 0.550 ÷ 0.098 = 11 days between the two weeks. Or fit an ordinary least-squares slope across the whole window, where the standard error of the estimated slope is the residual SD over the square root of the summed squared deviations of the x values. For n consecutive days that denominator has a closed form, n(n²−1)/12:
2σ ÷ √(n(n²−1)/12) < 0.098
n(n²−1) > 48σ² ÷ 0.098²
n ≈ ∛48 × (σ ÷ drift)^⅔
= 3.63 × (1.03 ÷ 0.098)^⅔
= 17.4 → n = 18 days
Use the robust σ of 1.26 lb, the larger of the two estimates, and it comes out at 20. So somewhere between two and three weeks of daily weigh-ins before the fitted rate on this log separates from zero at two standard errors.
Those 11 days are the distance between the two weeks’ midpoints, so counting from the first morning to the last, that route also spans 18 days. Both draw on the same information. Fitting a line is what the app uses on the Progress tab.
How long does it take at half a pound a week?
Twenty-two days of daily weigh-ins at this log’s noise level, and 31 days at the coverage it actually has. n ≈ 3.6 × (noise ÷ rate)^⅔ is the whole result, and the two-thirds power is what makes it useful: everything you can change moves the wait sublinearly.
| Real rate | lb/day | Days to clear noise (daily weigh-ins) | At 37% coverage |
|---|---|---|---|
| 0.5 lb/wk | 0.0714 | 22 | 31 |
| 0.68 lb/wk — this log | 0.098 | 18 | 25 |
| 1.0 lb/wk | 0.143 | 14 | 19 |
| 1.5 lb/wk — the app’s plan cap | 0.214 | 11 | 15 |
Halve your noise and the wait falls by 2^⅔ = 1.59×, not 2×. Double your rate of loss and you get the same 1.59×. Missing days cost you on a cube root too: of the log’s 226 daily values only 84 carry a real weigh-in, 37% coverage, and skipping two days in three multiplies every figure in that third column by 0.37^(−⅓) = 1.39.
Filling the gaps does not buy the days back. When interpolation is on, the app draws a straight line between the two known days either side, which adds points to the chart and no information to the estimate — interpolation changes the line without changing what it knows.
Bhutani and colleagues put a floor under all of this from the physiology side. Across 46 adults measured by isotope dilution and DXA, a unit of two-week weight change was 84% fat-free mass and 16% fat, at an average energy density of 2,380 kcal/kg — roughly a third of the ~7,700 kcal/kg that the familiar 3,500-kcal-per-pound figure assumes for fat tissue. A two-week read is mostly measuring fat-free mass, and total body water above all, almost regardless of how carefully you smooth it.
What does the app compute, and what does it leave out?
The app reports rates three different ways and puts an error bar on none of them.
- Progress tab, windowed rate: an ordinary least-squares slope of weight against time in days, multiplied by seven. It returns nothing at all unless the window spans at least three days — a deliberate guard against two weigh-ins hours apart producing an absurd number.
- Home’s goal card, unwindowed: on a scale basis, the same OLS slope over the last 28 days, falling back to the last 10 entries for sparse loggers. On a trend basis, the trend line’s own rate.
- Every trend method’s rate:
trend[t] − trend[t−7], a flat seven-index look-back on the smoothed line. Two methods sidestep it: the Kalman filter reports velocity from its own state, and Weekly Average differences this week’s mean against last week’s.
None of these carries a confidence interval, and the app does not test whether the rate it shows you differs from zero. That is the gap this arithmetic fills. The goal validator does enforce one hard rail in the same territory, capping any plan at 1.5 lb/week in both directions and in both scheduling modes. Read that cap through the table above and it is the quickest plan the app will accept, with 11 days between a fitted rate and legibility.
What actually shortens the wait?
Standardising the weigh-in works on the numerator, and needs no equipment. If your log closed the whole gap between 0.71–0.79% and Schneditz’s 0.53%, per-weigh-in noise would fall to about 0.73 lb and the 18-day wait to 14.
Weighing more days works on n. Coverage enters as a cube root, so it is weak per day added and strong across a month — going from 37% to daily coverage takes this log’s 25-day wait down to 18.
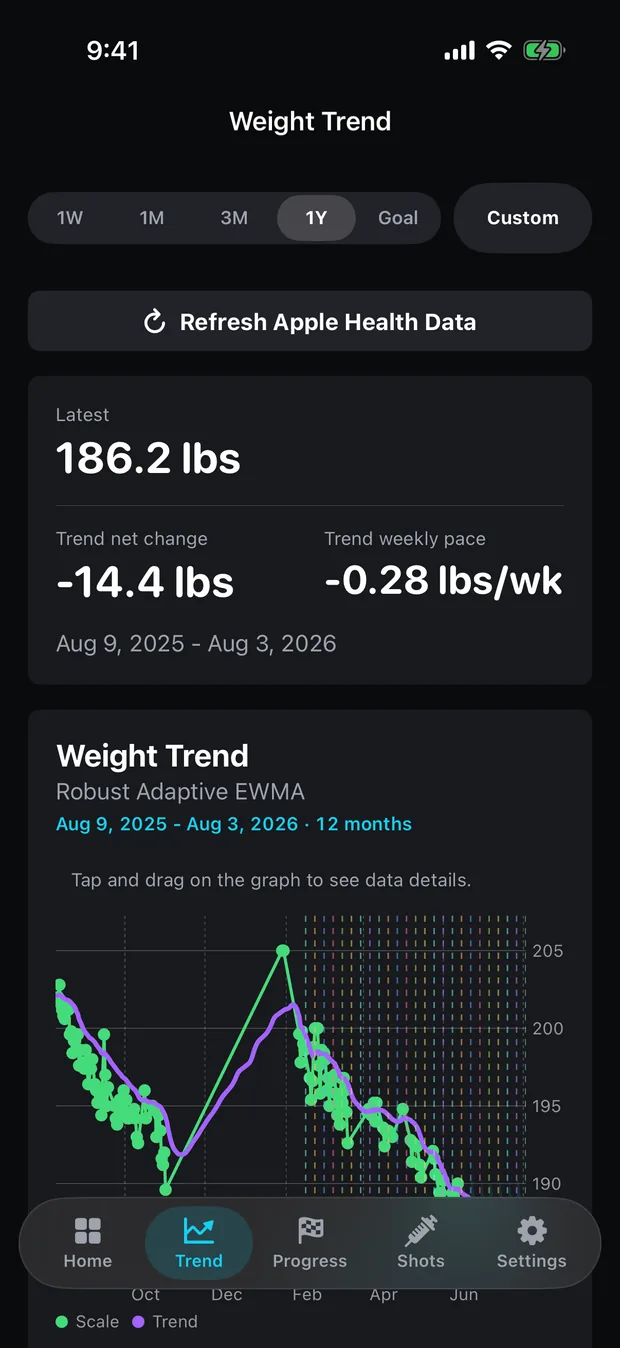
Smoothing works on neither of them. A trend method reduces the variance of what you look at; it does not reduce the variance of the underlying measurement, and a fast filter gives most of the reduction back. On this file the Robust Adaptive EWMA line moves 0.094 lb/day and the Hull moving average moves 0.368 lb/day, which at a 7-day window is close to tracing the scale. All fifteen methods are documented with their formulas and defaults on the methods page.
At 12 to 1, this file needs about two and a half weeks of daily weigh-ins before a fitted rate means anything. Run the two divisions on your own log and you will get your own number, and it is the only one that applies to you. The same division catches out fitness readings too, which is why active energy falls on identical training as the body doing it gets lighter. Bodyweight as a time series sets out the modelling frame, and Kaufman’s efficiency ratio is one filter’s attempt to detect the same thing adaptively. Your log stays in your own private iCloud database; the app runs no server, no account and no analytics of its own (privacy). If the arithmetic on your file comes out somewhere strange, support will walk through it with you.
Common questions
My scale hasn't moved in two weeks — has my weight loss stopped?
Two weeks is not long enough to say. At the rate in this log, twelve days of real change comes to 1.2 lb, which is the same size as the median overnight wobble in the same file. A least-squares rate fitted through daily weigh-ins takes 18 days to separate from zero at two standard errors, and comparing two single mornings takes 30.
How do I calculate my own signal-to-noise ratio from a weigh-in log?
Two divisions. Take your net weight change and divide by the number of days it covers — that is your drift. Then average the absolute difference between each pair of consecutive weigh-ins — that is your noise. Divide the noise by the drift. On one user's log — 84 weigh-ins over 225 days — that is 1.16 lb ÷ 0.098 lb/day = 11.9, so the noise runs roughly twelve times the size of the signal.
How long before real weight loss shows up on the scale?
It depends on your rate and your noise, and the relationship is n ≈ 3.6 × (noise ÷ rate)^⅔ days, with the noise in lb and the rate in lb per day. Losing 0.68 lb/week — 0.098 lb/day — with per-weigh-in noise of 1.03 lb takes 18 days of daily weighing. Losing 1.5 lb/week takes 11.
Why does my weight go up during a week I was in a deficit?
Because a single interval carries almost no information at this ratio. In one user's log, 30 of 83 intervals (36%) were gains over a stretch that ended 22 lb down. Bhutani and colleagues measured 46 adults over two weeks and found 84% of the weight change was fat-free mass.
Sources
- Schneditz et al., 'Day-to-day variability in euvolemic body mass', Renal Failure 45(2), 2023 — 9,521 standardised daily measurements
- Bhutani, Kahn, Tasali & Schoeller, 'Composition of two-week change in body weight under unrestricted free-living conditions', Physiological Reports 5(13):e13336, 2017
- Simple linear regression — standard error of the estimated slope
- Median absolute deviation — the 1.4826 consistency constant
- The Hacker's Diet — Signal and Noise (John Walker)