
Can you use trading indicators on your weight? DEMA, HMA, KAMA
Yes, as long as the filter reads one number per period: DEMA, TEMA, HMA and KAMA port to a weigh-in log unchanged, though the market assumptions behind them do not. In one user's log — 84 weigh-ins over 225 days — the mean absolute day-over-day change is 1.16 lb against a drift of 0.098 lb/day, so the noise is 11.9× the signal, and the four filters finish 4.0 lb apart on identical data.

What does a weigh-in log look like as a time series?
Strip the labels off a weigh-in log and what remains is a univariate series, sampled once a day at best, carrying a small deterministic drift under a large stochastic term. That is the whole modelling problem.
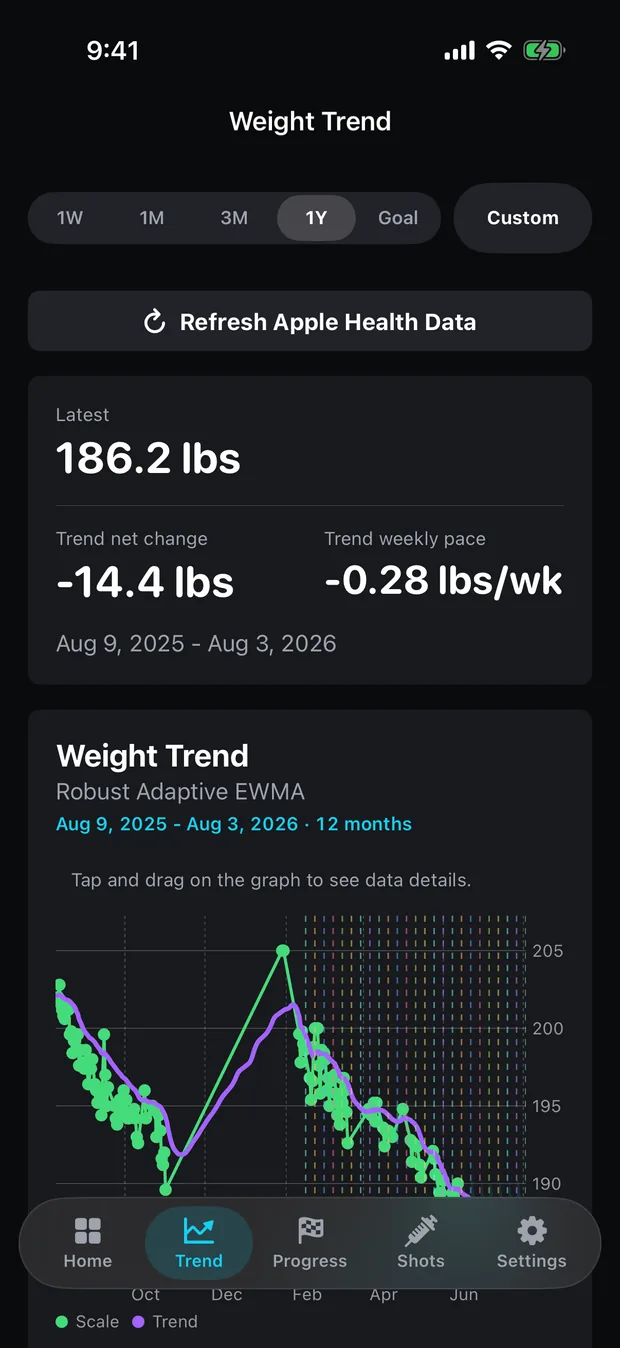
One user’s log — 84 weigh-ins over 225 days — puts numbers on it. Net change over the whole run: −22.0 lb, from a 205.0 lb high to a 183.0 lb low. Underlying drift: 0.098 lb/day. Mean absolute day-over-day change: 1.16 lb, standard deviation 1.45 lb. So the daily noise runs about 11.9× the daily signal.
The size of that noise varies. The 90th percentile of the daily change is 2.2 lb against a median of 1.2, and the largest single-day swing in the file is 5.4 lb — four and a half times the median, in a body that lost twenty-two pounds over seven and a half months.
The consequence is the one every quant already knows: at that ratio the sign of a single increment carries almost no information. 30 of 83 intervals (36%) in that log were gains, over a stretch that ended 22 lb down.
Why do price-chart filters work on weigh-ins at all?
They work because none of these filters knows what it is smoothing. DEMA, TEMA, HMA and KAMA each take one scalar per period and emit one scalar per period. A causal recurrence over a single number does not care whether the number is a closing price or a Tuesday morning weight.
Three structural properties do carry over cleanly:
- Non-stationary in level, roughly stationary in increments. You model changes, not levels, in both.
- Increments with a tail. The biggest daily move in this log is 5.4 lb against a 1.2 lb median, so one morning can drag a short average well off.
- A calendar with holes in it. Markets skip weekends; you skip the mornings you were travelling. In that 225-day log, only 84 days carry an observation — 37% coverage.
That last one is why every method but Weekly Average runs on a rebuilt daily series rather than on the raw rows: same-day weigh-ins are averaged, and for the methods that fill gaps at all, missing days get straight linear interpolation between the two known days either side. Interpolation changes the line more than most people expect, and it is a choice a price chart never forces on you.
Where does the price analogy break down?
| Property | Daily price bar | Daily weigh-in |
|---|---|---|
| What arrives each period | open, high, low, close, volume | one scalar, if you stood on the scale |
| Coverage | every session | 84 days out of 225 in this user’s log |
| Source of the noise | quoting, liquidity, order flow | hydration, glycogen, gut contents, sodium |
| Drift in the underlying | unforecastable under the martingale result | 0.098 lb/day, sustained across 225 days |
The missing column is the expensive one. Every volume-weighted indicator, every bid-ask bounce filter — none of it ports, because there is no volume and no spread. The nuisance process on a scale is water, and water does not mean-revert on a schedule you can trade around.
One calendar effect does exist, and it is the closest thing to seasonality the data has. Orsama and colleagues tracked 80 adults across 4,657 weight measurements over 15–330 monitoring days and found a weekly rhythm: weight was highest on Sunday and Monday and fell toward the end of the week, with increases starting Saturday and decreases starting Tuesday. Worth knowing before you read anything into a Monday number. None of the app’s filters models it — the Holt-Winters option carries no seasonal component at all.
Is your weight as unpredictable as a stock price?
No, and that flips the filter’s job. Samuelson’s 1965 result is that in an informationally efficient market the properly discounted price follows a martingale, so increments are unpredictable given the available information. Trend-following on a price chart is therefore a search for something the theory says may not be there.
Nothing arbitrages away a caloric deficit. The drift in your weigh-in log is real, it is signed, and it persists: 0.098 lb/day across 225 days in this user’s file. So the filter here has the easier job of the two. It estimates a rate you already know is there and simply cannot see.
That changes what “good” means. On a chart, lag costs you the entry. On a scale, you are not trying to catch a turn early enough to trade it — you are trying to read this week’s rate without a Tuesday water swing rewriting it. Variance in the estimate costs more here than lag does, which is why the app’s default is a heavily damped filter and not the fastest one available. More on that tradeoff in how long a real change takes to clear the noise.
How do DEMA, TEMA, HMA and KAMA compare on the same 84 weigh-ins?
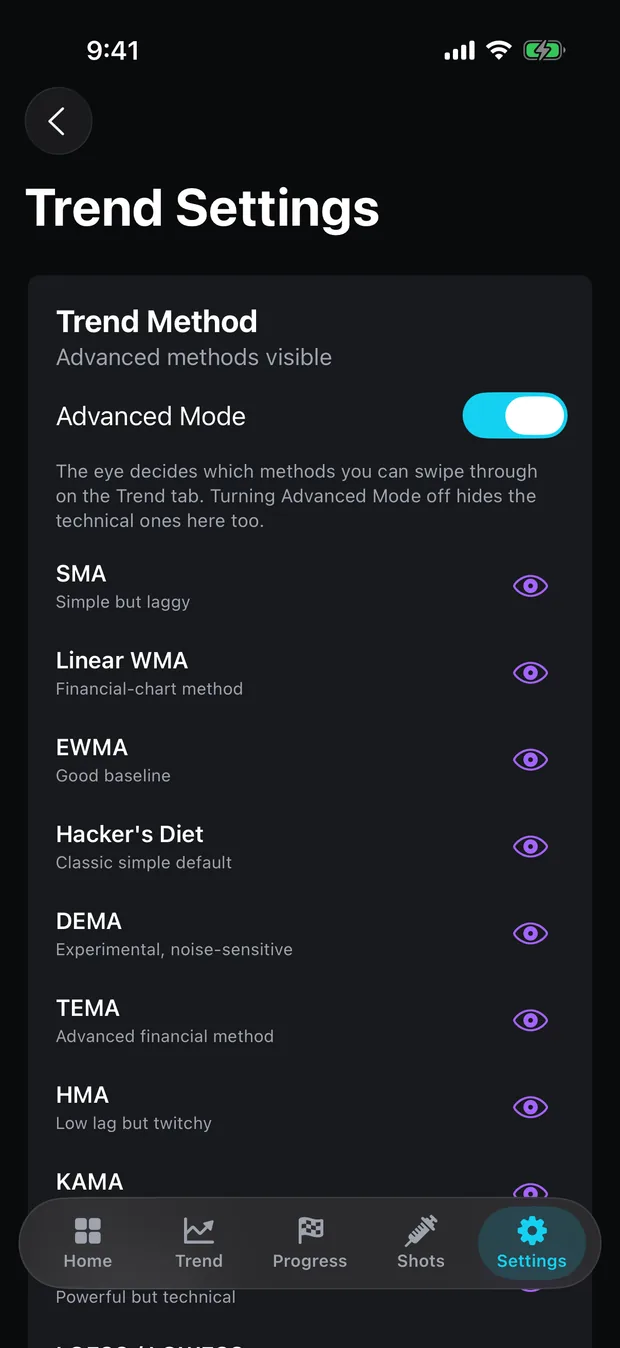
All four ship under Advanced Mode. Here is what each produced on this user’s log at the app’s default parameters, with plain EWMA as the reference line. “Line moves” is the mean absolute day-to-day change in the trend line; “ignored” is the share of the scale’s own daily movement the line does not pass through.
| Method | Default parameters | Line moves/day | Scale movement ignored | Final reading |
|---|---|---|---|---|
| EWMA (reference) | α = 0.1 | 0.103 lb | 75.9% | 184.5 lb |
| DEMA | α = 0.1 | 0.152 lb | 64.7% | 183.6 lb |
| TEMA | α = 0.1 | 0.196 lb | 54.4% | 183.3 lb |
| HMA | window 7 | 0.368 lb | 14.3% | 182.9 lb |
| KAMA | slow 0.04 / fast 0.22 / ER window 10 | 0.080 lb | 81.3% | 187.0 lb |
Same file, same day, same body: 182.9 lb to 187.0 lb, a 4.0 lb spread. Those two are also the extremes of all fifteen methods the app offers — every other method finishes inside this range.
Why do DEMA and TEMA lag less than a plain EWMA?
Both subtract a smoothed copy of themselves and add the difference back. Patrick Mulloy published them in Technical Analysis of Stocks & Commodities in 1994 — DEMA in January (V.12:1, pp. 11–19), TEMA the following month (V.12:2, pp. 72–80). The forms are short:
DEMA = 2·EMA1 − EMA2
TEMA = 3·EMA1 − 3·EMA2 + EMA3
where EMA2 = EMA(EMA1) and EMA3 = EMA(EMA2). Subtracting a smoothed copy of the smoothed series gives the composite kernel negative weights in its tail, which is exactly how the lag comes down — and exactly why the line can overshoot a step.
The app parameterises both by α rather than by period. At the default α = 0.1, the standard conversion α = 2/(n+1) puts them at roughly a 19-period DEMA and TEMA, which is a useful anchor if you are used to reading them at n = 20 on a chart.
The cost shows up in the table. At the same α, plain EWMA passes through 24.1% of the scale’s daily movement; DEMA passes 35.3% and TEMA passes 45.6%. TEMA tracks about 1.9× as much daily noise as the EWMA it is built from. That is the trade, stated numerically: DEMA and TEMA lag reduction goes into the kernel weights in detail.
Why does the Hull moving average follow every weigh-in at n = 7?
Because at a 7-day window its final smoothing stage runs over two points. Alan Hull published the HMA in 2005, and the definition nests three weighted moving averages:
HMA(n) = WMA( 2·WMA(n/2) − WMA(n), √n )The app implements it exactly that way, using wmaWindow for n, default 7. Which means: the half-window WMA runs over 3 points, the full WMA over 7, and the final smoothing WMA runs over Int(√7) = 2 points.
Two points is barely a filter. That single truncation explains the whole HMA row: 14.3% of daily movement ignored, second lowest of any method the app offers, behind the Kalman filter at 5.5%. Its line moves 0.368 lb/day, more even than the 7-day simple moving average’s 0.295 lb. At a 7-day window the HMA is close to tracing the scale.
It is also why HMA finishes lowest of the four, and lowest of all fifteen, at 182.9 lb. It is sitting on the recent lows because it is following them. Raise the window and the square root grows with it: at n = 25 the final stage runs over 5 points instead of 2. The parameter editor that lets you do that is Pro. Hull moving average on the scale works through the window choice.
Why is KAMA the slowest of the four? The squared efficiency ratio
Because the smoothing constant it picks then gets squared. Perry Kaufman’s adaptive average sets that constant from how directly the series travelled. The efficiency ratio over the last n periods is the absolute net change divided by the sum of the absolute period-to-period changes — 1.0 for a perfectly straight run, near 0 for churn — and the smoothing constant is:
SC = [ ER × (fast − slow) + slow ]²Note the square. It is in the standard formula and in the app’s implementation both.
The app’s constants are slow 0.04, fast 0.22, ER window 10. Squared, the effective α runs from 0.04² = 0.0016 at pure churn to 0.22² ≈ 0.048 at a perfectly efficient run. The ceiling sits below plain EWMA’s flat 0.1. Kaufman’s own published constants — fast 2/(2+1), slow 2/(30+1) — square to a range of 0.0042 to 0.444, so the app’s KAMA is far more damped than the textbook one at every value of ER.
That is the entire KAMA row. It ignores 81.3% of the scale’s daily movement, its line moves 0.080 lb/day, and it finishes at 187.0 lb — 4.0 lb above the last weigh-in in the file. It will not flinch at a bad morning, and it will not confirm a real move quickly either. The efficiency ratio during fat loss covers what ER actually reads on a weigh-in log, where a straight run is rarer than it is in price data.
What does the app deliberately refuse to do?
- No automatic method selection, no per-user tuning, no model fitting. You pick one and it runs. There is no ML anywhere in the trend code.
- Every method’s weekly rate is the same 7-index look-back on the trend line,
rate = trend[t] − trend[t−7], not a regression. A twitchier filter therefore gives you a twitchier rate — the Kalman filter is the one exception, because it reports velocity from its own state. - DEMA, TEMA, HMA and KAMA always interpolate missing days, regardless of the global interpolation setting. Only EWMA and the default Robust Adaptive EWMA follow it.
- The trend chart is a Pro feature, and Advanced Mode is where these four live. The Scale tab’s raw weight chart stays free, along with every weigh-in you log — see what stays free.
A 4.0 lb spread across four filters on identical data comes down to one question answered four ways: how much of yesterday do you believe? Switch after a bad week and all you have done is pick the friendlier line. Pick the failure mode you can live with — HMA will hand you the occasional scare, KAMA will hand you a stale reading — and then leave it alone for a month. Choosing a trend method walks the decision and all fifteen are documented with their formulas and parameters. The log syncs through your own private iCloud database and nowhere else; the app runs no server, no account and no analytics of its own (privacy). If a number on your log looks wrong, support will go through the arithmetic with you.
Common questions
Can you use stock-chart moving averages on bodyweight?
The price-only ones, yes. DEMA, TEMA, HMA and KAMA each take one number per period and return one number per period, so nothing in them assumes a market. Anything that reads volume, open/high/low, or an order book has no analogue on a bathroom scale.
Which of DEMA, TEMA, HMA and KAMA lags least?
HMA, by a wide margin. On one user's log it passes through 85.7% of the scale's daily movement and its line moves 0.368 lb per day — more than a 7-day simple moving average. KAMA sits at the opposite end, ignoring 81.3% of that movement.
Why do two filters give different weights on the same day?
They weight the past differently, so they answer a different question. On the same 84 weigh-ins the four methods finish between 182.9 lb and 187.0 lb, a 4.0 lb spread. Those are the lowest and highest finishes of any of the fifteen methods the app offers, so the other eleven all land inside them.
Sources
- Mulloy, P. G. — 'Smoothing Data With Faster Moving Averages', Technical Analysis of Stocks & Commodities, V.12:1 (Jan 1994), pp. 11–19
- Mulloy, P. G. — 'Smoothing Data With Less Lag', Technical Analysis of Stocks & Commodities, V.12:2 (Feb 1994), pp. 72–80
- Triple Exponential Moving Average (TEMA) — StockCharts ChartSchool
- Alan Hull — The Hull Moving Average
- Hull Moving Average (HMA) — StockCharts ChartSchool
- Kaufman's Adaptive Moving Average (KAMA) — StockCharts ChartSchool
- Random walk hypothesis — Samuelson (1965) and the martingale property
- Orsama et al., 'Weight Rhythms: Weight Increases during Weekends and Decreases during Weekdays', Obesity Facts (2014)