How much is still in your system? A free estimate, explained
Peptrend estimates how many milligrams of a logged GLP-1 remain with a one-compartment model: each dose is absorbed toward a published time to peak, halves every half-life, and all doses are summed. The chart and Home card are free. At the app's semaglutide settings, 54% of one dose is still counted a week later. It is a milligram estimate, never a blood level, with one curve per medication.
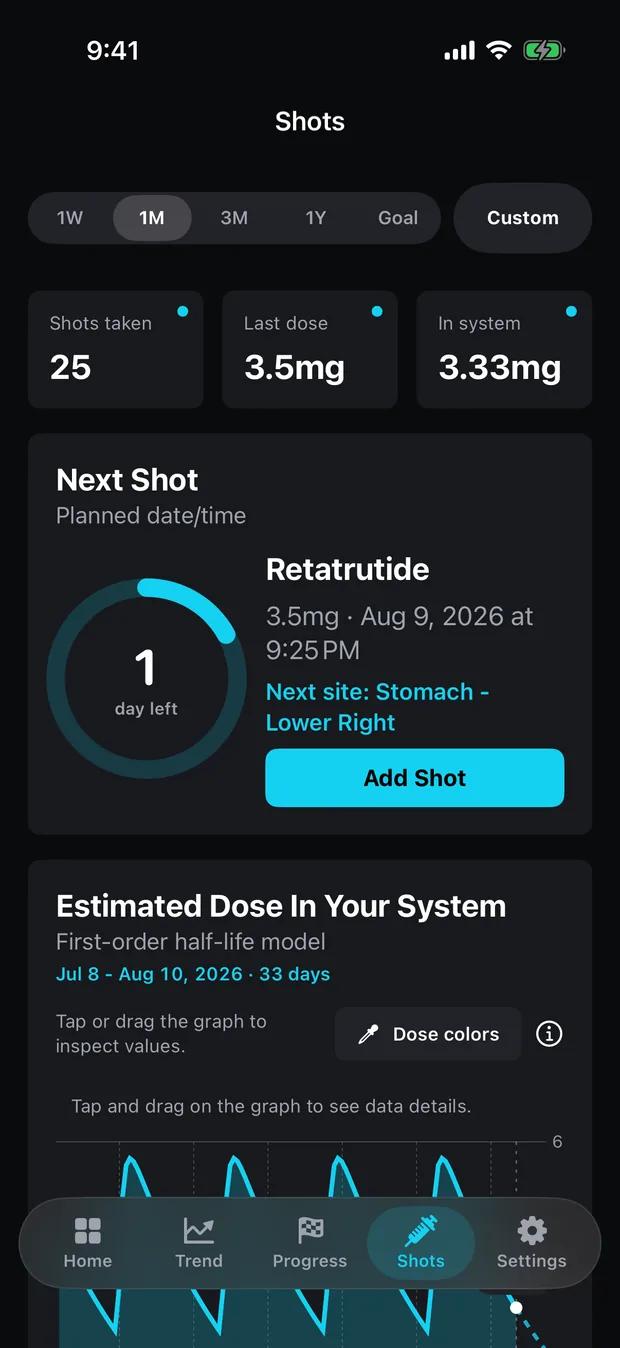
Open the Doses tab in Peptrend and the card under Next Shot is headed Estimated Dose In Your System. It draws a curve from the doses you logged, and a line under it reads the current value in milligrams. Home repeats the number on a card of its own. None of it sits behind the paywall. This post covers what the number is, how to read it, and the places where it stops being useful.
What does the In Your System figure estimate?
It estimates how many milligrams of your logged doses are still in the body, using a one-compartment model with first-order absorption and first-order elimination. For one dose D taken t days ago:
A(t) = D · F · ka/(ka − ke) · (e^(−ke·t) − e^(−ka·t))ke is ln(2) divided by the half-life. ka, the absorption rate, is solved from the medication’s published time to peak. F is the absorbed fraction, 1.0 for an injection and a small fraction for a tablet. The app adds up that expression for every dose of the medication you marked as taken, and the sum is the curve.
The result is an amount, in milligrams. The model has no volume of distribution, no clearance and no ng/mL anywhere in it, so nothing it computes can be a concentration in the blood. The app says so under the chart’s info button: “This is a simple planning estimate for visualization. It is not a blood concentration model or medical dosing advice.” The card title changed once for the same reason. It used to read “Circulating”, and that word was dropped because it implied a plasma measurement the model never makes.
How much of one dose does the model still count after a week?
About half, for semaglutide at the app’s settings. The table runs the app’s own formula for a single dose of each of two injected presets, in an otherwise empty log:
| Preset | Half-life | Time to peak | Peak share of the dose | Day 7 | Day 14 | Day 28 | Day 35 |
|---|---|---|---|---|---|---|---|
| Semaglutide (injection) | 7.0 days | 48 h | 82% at 48 h | 54% | 27% | 7% | 3% |
| Tirzepatide | 5.0 days | 24 h | 87% at 24 h | 40% | 15% | 2% | 1% |
Two things in that table surprise people. The first is that no single dose ever reaches its own full amount. Elimination runs the whole time absorption does, so a 1 mg semaglutide dose peaks in the model at about 0.82 mg, two days in. The second is the length of the tail. Each week removes the same share of whatever is left, so the last few percent take weeks to go. The Ozempic label says the same thing in plain words: with an elimination half-life of about a week, semaglutide “will be present in the circulation for about 5 weeks after the last dose.”
Why does the number climb through the first month?
Because each weekly dose lands before the last one has gone. At the semaglutide settings above, a steady 1 mg once a week settles into a cycle that runs from about 1.73 mg, a day and a half after each dose, down to about 1.07 mg just before the next. The first dose alone never gets near that. The climb takes four to five half-lives, which matches the label’s 4 to 5 weeks to steady-state exposure.
So a reading means little without its position in the week. The same log reads high the day after a dose and low the day before one. How long a GLP-1 takes to reach steady state builds the plateau dose by dose, and reading the absorption curve covers the rising edge of each hump.
Is the level chart free in Peptrend?
Yes, all of it. The Estimated Dose In Your System chart, its “Current” line and the In Your System card on Home carry no Pro gate in the shipping app. The one Pro control on that card is the Dose colors button, which shades the curve by dose size. The Next Shot card above it, with its countdown ring and suggested site, is free too, and so is the single reminder when a dose is due.
What is Pro on the same tab is the Dose Over Time chart, the colour controls and the reconstitution calculator. On other tabs, the weight trend line and everything computed from it are Pro. What stays free has the full list.
Do other apps show a level estimate?
Several do, so a free level chart is not what sets Peptrend apart. On 18 September 2026, Shotsy’s listing advertised estimated medication levels for four GLP-1s, “based on peer-reviewed clinical data”. GlucoPal’s advertised “an estimated medication-level chart”. Glapp’s site describes a level curve for semaglutide and tirzepatide, and Flat Six’s Peptide Tracker advertises an estimated level curve for every compound and calls itself 100% free. Shotsy’s and GlucoPal’s listings do not say which tier the chart belongs to.
The difference is in what you can see and change. Peptrend names its model, prints the half-life, time to peak and absorbed fraction it is using, and lists its sources under the chart’s info button as live links. Those are FDA labels for most of the approved drugs, published papers for oral semaglutide’s absorption and retatrutide, and a review covering GLP-1 drugs as a class. Orforglipron’s source is a phase 1a paper in version 1.3.3 and the Foundayo label from version 1.4.0 on. The four other research compounds have no source listed. All three constants can be edited. And a tablet is scaled by its absorbed fraction dose by dose, so a history that moves from injections to tablets still adds up.
What can the estimate not tell you?
It is a textbook model with published average constants, and it knows nothing about you. It has not been checked against anyone’s blood work, and absorption varies between people and between doses. The research-compound presets use best published estimates, and those five carry the app’s own flag: “Not FDA approved, research use only.”
It also keeps each medication on its own curve. Since version 1.5.0 every dose decays by the numbers of the medication it was logged as, and a second medication gets a line of its own rather than a share of the first one’s; the lines are never added, because milligrams of two drugs are not one amount. Before 1.5.0 the curve followed one medication name and left doses under any other name out. Tracking two medications at once covers how the second one is added.
And it does not advise. The app never suggests a dose, a titration step or a draw volume. The reconstitution calculator stops at mg/mL, for the reasons in why a calculator should refuse.
One defect affects small doses, and which version you are on decides whether it bites. Version 1.3.3 shows doses to one decimal place, so a 0.25 mg dose displays as 0.2 mg, and editing any field of that entry saves it back as 0.2 mg. A new entry copies the last dose the same rounded way. On 1.3.3, type the dose in full each time you add or edit one, and the model receives the value you typed. Since version 1.4.0, the app prints and pre-fills a dose at the precision it was typed, up to three decimal places, and an edit sheet saved without touching its number hands back the stored value itself, so correcting a date can no longer round the dose beside it.
How do you set it up?
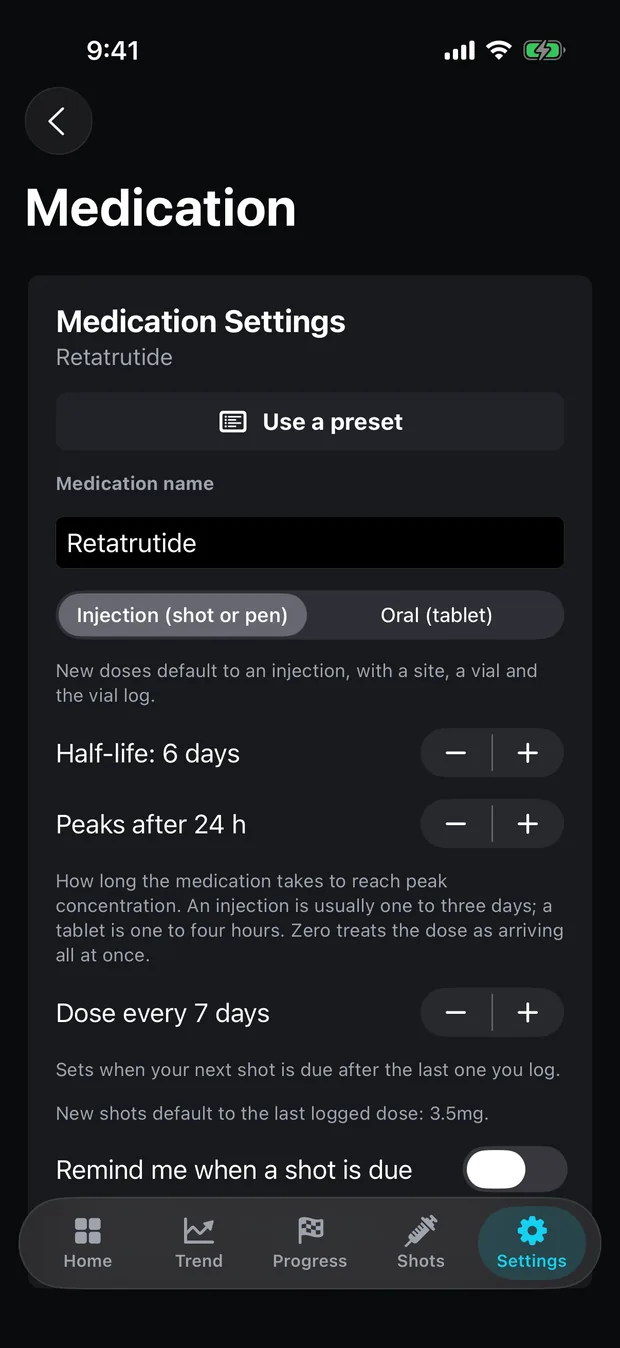
Pick a preset in Settings › Medication, then log your doses. The eleven presets fill in a half-life, a time to peak, an absorbed fraction and a dosing interval, and “Something else” lets you set your own. The half-life accepts 0.05 to 30 days. The time to peak runs from zero, which treats a dose as arriving all at once, to 120 hours.
Then log each dose with its real date and time and leave it marked as taken. An untaken dose stays in the history and is left out of the curve. The chart draws from the timestamps you logged, so an irregular schedule draws an irregular curve, and the interval setting only drives the next-dose date and the reminder. What to log with every dose covers the other fields. Weekly versus daily dosing shows how the same model draws a daily tablet. If the curve in your log does not match the arithmetic here, support is where to say so.
Common questions
How much semaglutide is left in your system a week after one dose?
At the values Peptrend ships for semaglutide injections, a 7.0-day half-life and a 48-hour time to peak, about 54% of a single dose is still counted by the model a week later, 27% after two weeks and 7% after four. Those are modelled milligrams, not a blood test.
Is Peptrend's medication level chart free?
Yes. The Estimated Dose In Your System chart on the Doses tab, its current-value line and the In Your System card on Home carry no Pro gate. The only Pro control on that card is the Dose colors button, which shades the curve by dose size.
Is the In Your System number a blood level?
No. It is an amount in milligrams. The model has no volume of distribution, no clearance term and no ng/mL, so it cannot produce a concentration. The app's own copy calls it a planning estimate for visualization.
Can the chart show two medications at once?
Yes, since version 1.5.0. Each medication gets its own curve, with its own half-life, time to peak and absorbed fraction, and the curves are never added together, because milligrams of two drugs are not one amount.
Sources
- OZEMPIC (semaglutide) injection — prescribing information, section 12.3, DailyMed
- Hallare J, Gerriets V. Elimination Half-Life of Drugs. StatPearls, NCBI Bookshelf
- Shotsy GLP-1 Tracker on the US App Store
- GlucoPal (Zepbound & Mounjaro Tracker) on the US App Store
- Peptide Tracker Log & Reminder (Flat Six Labs) on the US App Store
- glapp.io — medication level curve