When does a GLP-1 peak after injection? Tmax and the absorption curve
A GLP-1 injection peaks hours to days after it goes in: labels put semaglutide at 1 to 3 days and tirzepatide at 8 to 72 hours. Peptrend gives every dose two rate constants, ka for absorption and ke for elimination, and solves ka from the published Tmax. Every peak lands at D × F × 2^(−Tmax ÷ half-life) — 89% of a retatrutide dose, 82% of a semaglutide injection. The number is milligrams.
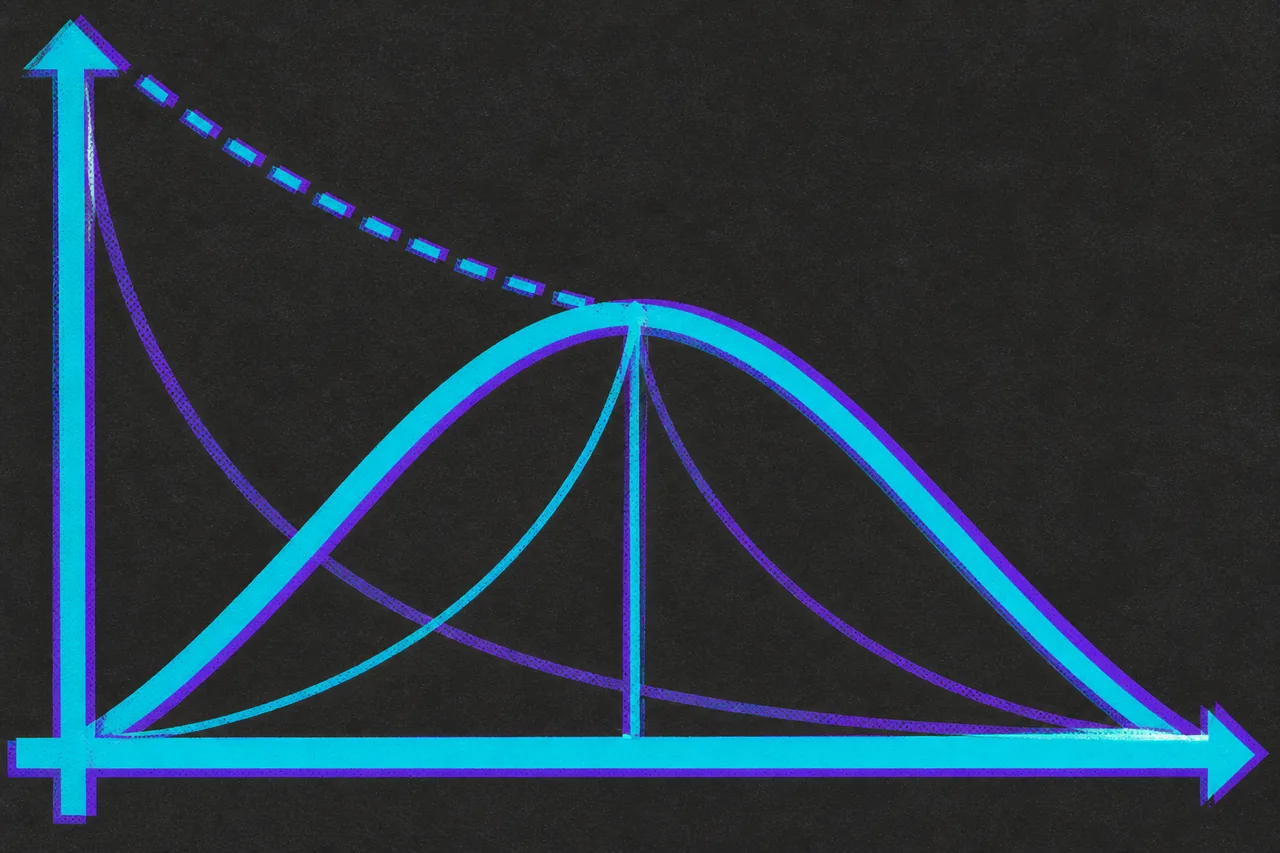
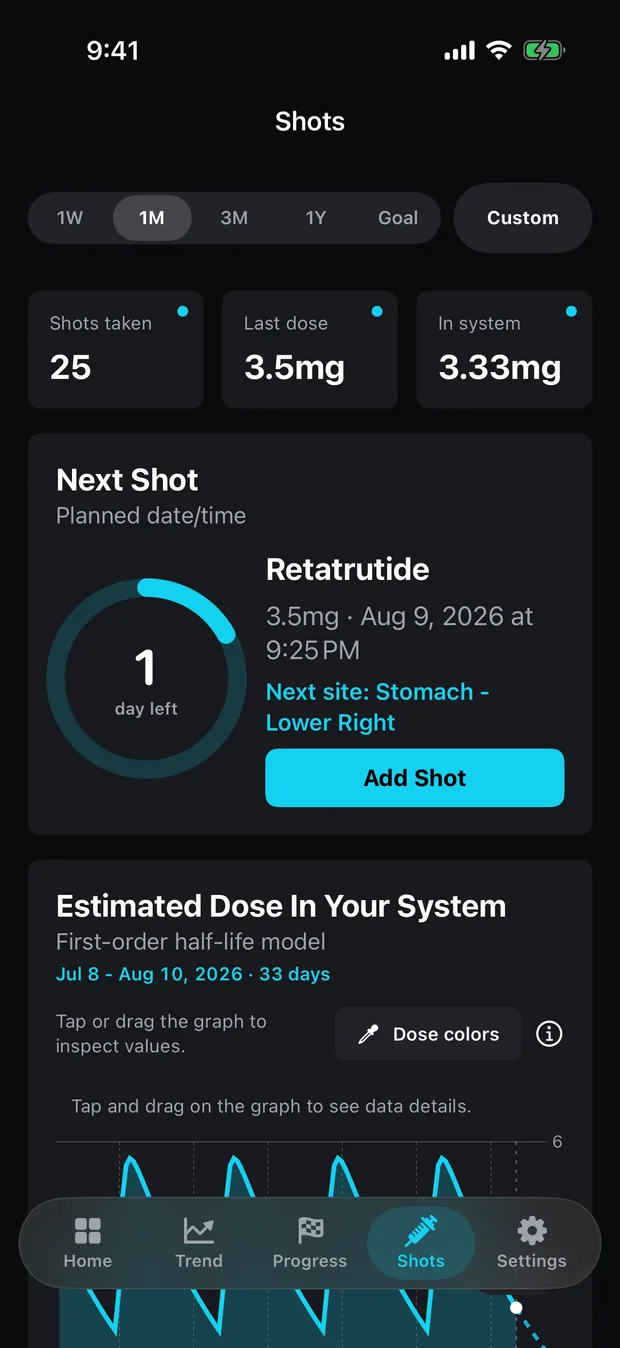
The chart under Estimated Dose In Your System does something a single decay curve cannot. After each injection the line climbs for a while before it turns over, so a month of weekly doses reads as a row of rounded humps.
That shape takes a second rate constant. One for the drug arriving, one for it leaving.
Why does the level climb after a shot before it falls?
The amount still in the body t days after a single dose is the Bateman function — first-order arrival into a one-compartment body, first-order removal from it:
A(t) = D · F · ka/(ka − ke) · (e^(−ke·t) − e^(−ka·t))Term by term:
Dis the dose you logged, in milligrams. Peptrend has no other dose unit.Fis the fraction of that dose the model lets in at all, applied per dose by that dose’s own route. Every shipped injection preset usesF = 1. The two oral presets carry real numbers: semaglutide tablets ship at 0.008, and the orforglipron preset in 1.4.0 at 0.77, the geometric mean absolute bioavailability its FDA label reports at the 0.8 mg dose. Versions through 1.3.3 used 0.35 there, from a phase 1a study written before the drug had a label. A swallowed semaglutide tablet therefore enters the model at eight thousandths of its printed milligrams.keis elimination, per day, and it is the half-life rewritten:ke = ln(2) / t½. Six days gives 0.1155 per day.kais absorption, per day — how fast the depot under your skin hands the drug over.- The bracket
(e^(−ke·t) − e^(−ka·t))carries the shape. Two exponentials racing. Early on the second term collapses faster and the gap widens; later the second term has died and the first governs the fall.
Set absorption to zero hours and the app collapses to A(t) = D · F · e^(−ke·t), the ka → ∞ limit. That is the shape most people picture, and it stays available — the stepper reads “Peaks: immediately” at zero. It draws a vertical line at every injection and a curve that only ever falls, so the maximum lands at the moment of the dose. Every label quoted below puts the peak hours or days later.
What is Tmax, and when does each GLP-1 peak?
Tmax is where the two rates cross. Absorption is adding drug faster than elimination clears it, until it isn’t; the slope hits zero, and that instant is the peak. Solve dA/dt = 0 and out comes the standard expression, which the University of Lausanne’s pharmacokinetics reference prints as (ln ka − ln λ) / (ka − λ):
Tmax = ln(ka/ke) / (ka − ke)Labels publish Tmax, so Tmax is what Peptrend asks for. Ozempic’s prescribing information says maximum concentration “is reached 1 to 3 days post dose”. Mounjaro’s says the time to maximum plasma concentration of tirzepatide “ranges from 8 to 72 hours”. Trulicity’s gives dulaglutide 24 to 72 hours at steady state, “with a median of 48 hours”. The app ships 48, 24 and 48 hours for the three, so two of its three numbers are one pick out of a range the label reports as wide.
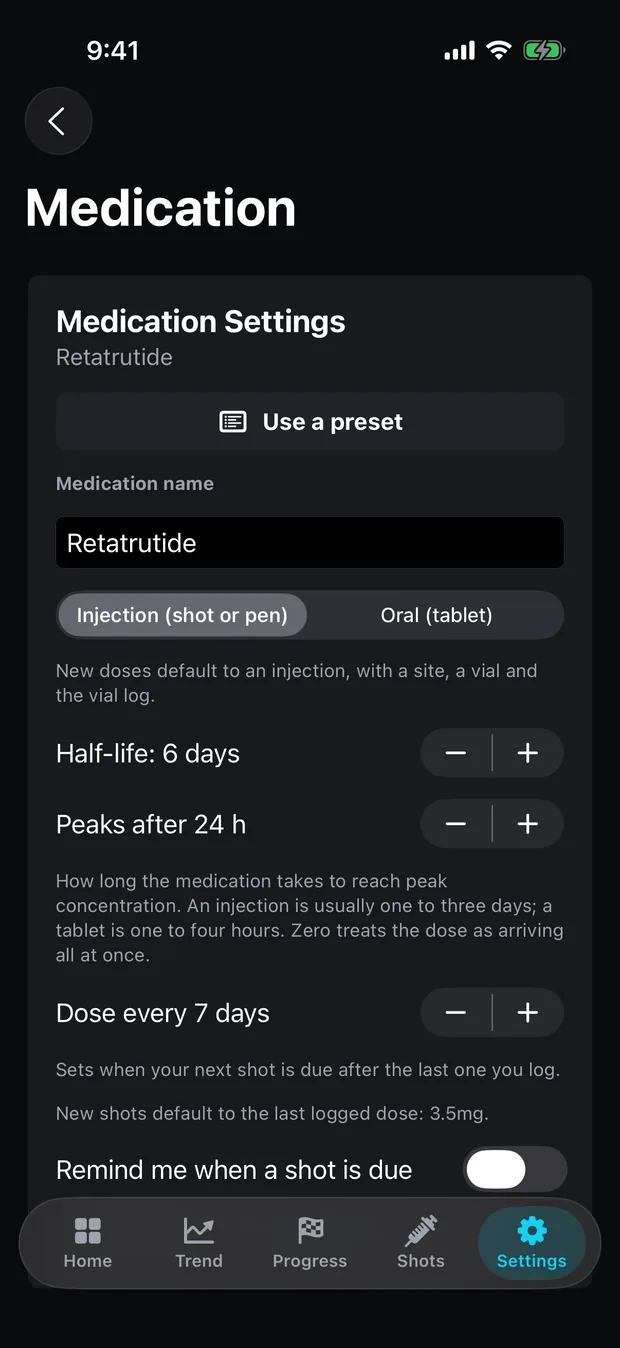
In Settings → Medication it is a single stepper, Peaks after N h, clamped to 0–120 hours, sitting directly under the half-life stepper. Choosing a preset writes both at once, along with the route, the interval and the bioavailability — and it asks first, because it will overwrite a half-life you tuned by hand.
How the app gets from a published Tmax to an absorption rate
The app searches for ka, because Tmax = ln(ka/ke)/(ka − ke) will not rearrange: ka appears inside the logarithm and again in the denominator.
What makes the search safe is monotonicity. Raise ka and the implied Tmax falls, every time, so bisection cannot get lost. The routine brackets the answer between ke × 1.000001 at the bottom and max(2·ke, 1) at the top, doubles the top until the Tmax it implies is early enough to contain the target — capped at 200 doublings — then halves the bracket 80 times. Retatrutide’s top doubles twice, 1 to 2 to 4 per day, before the answer is inside. A four-wide bracket is down to the last bit of a 64-bit float after about fifty halvings; the remaining thirty cost nothing and buy the same answer on any input.
The solve runs once per chart series and is carried through the whole walk; no grid point repeats it. What comes back, at the values the presets ship:
| Preset | Half-life | Tmax shipped | ke (per day) | ka (per day) | Absorption half-life |
|---|---|---|---|---|---|
| Semaglutide (injection) | 7.0 d | 48 h | 0.0990 | 1.44 | 11.6 h |
| Tirzepatide | 5.0 d | 24 h | 0.1386 | 3.31 | 5.0 h |
| Dulaglutide | 5.0 d | 48 h | 0.1386 | 1.23 | 13.5 h |
| Liraglutide | 0.55 d | 10 h | 1.2603 | 4.08 | 4.1 h |
| Retatrutide | 6.0 d | 24 h | 0.1155 | 3.54 | 4.7 h |
Retatrutide is one of five presets flagged “Not FDA approved, research use only.” Its 6-day half-life and 24-hour Tmax are best published estimates rather than label values, and the app’s dose info sheet links the trial it cites for them.
How high does a single dose actually get?
All of those curves peak at exactly D · F · e^(−ke·Tmax), which is the same number as D · F · 2^(−Tmax ÷ half-life). Two lines get you there. At the peak, ke·e^(−ke·t) = ka·e^(−ka·t); substitute that back into the Bateman expression and the ka/(ka − ke) factor cancels against (1 − ke/ka), leaving pure decay.
So absorption governs how you climb to the top, and the half-life alone governs how high the top is. A dose that takes 24 hours to peak arrives with 24 hours of elimination already spent.
| Preset | Tmax ÷ half-life | Peak, as a share of the dose |
|---|---|---|
| Semaglutide (tablet) | 0.010 | 99.3% |
| Orforglipron, the 1.4.0 preset | 0.156 | 89.7% |
| Retatrutide | 0.167 | 89.1% |
| Tirzepatide | 0.200 | 87.1% |
| Semaglutide (injection) | 0.286 | 82.0% |
| Dulaglutide | 0.400 | 75.8% |
| Liraglutide | 0.758 | 59.1% |
A single 3.5 mg retatrutide injection, alone in an empty system, therefore tops out at 3.12 mg. It never reaches 3.5. The two oral presets sit at the top of that column because their Tmax is measured in hours against a half-life measured in days, and the percentage is of the absorbed fraction — 99.3% of a semaglutide tablet is 99.3% of 0.8%. Orforglipron’s row moved when the preset did: on the phase 1a numbers versions through 1.3.3 carry, a 2.3-day half-life and a 3-hour peak, the same arithmetic gives 0.054 and 96.3%.
Stack the doses and the reading changes again, because each one lands on the residue of the last. That arithmetic, and the four-to-five-half-life climb behind it, is in how long a GLP-1 takes to reach steady state.
Can a dose peak later than 1.44 half-lives?
There is a ceiling on Tmax, and it is 1/ke — 1.4427 × the half-life. The bisection only searches above ke, and on that side the implied peak time converges on 1/ke as ka falls toward ke. Ask for a later peak and the search has nowhere to land.
It settles on ka ≈ ke when that happens, and the curve peaks at 1/ke holding 1/e — 36.8% — of the dose. That is the hard floor under every figure in the peak table, and it obeys the same rule as the rest of them, since e^(−ke × 1/ke) is e^(−1).
The ceiling only bites at short half-lives. The Peaks-after control accepts up to 120 hours, so at a 6-day half-life the 208-hour ceiling can never be reached. Liraglutide’s 13.2-hour half-life puts its ceiling at 19 hours, and BPC-157’s four hours put it under six. Every injection preset ships well inside its own limit. This is a property of the model, not a claim about the drug.
Is the “in your system” number a blood concentration?
Milligrams in, milligrams out. The card is headed “Estimated Dose In Your System” under the subtitle “First-order half-life model”, and the calculation contains no volume of distribution, no clearance term and no ng/mL. Nothing in it could produce a plasma concentration. The app’s own explainer says the estimate “is not a blood concentration model or medical dosing advice”, and the disclaimer says the figure “may differ substantially from the actual concentration of any substance in your body”.
Two more honest edges. The injection presets all use F = 1, while Ozempic’s label reports absolute bioavailability of 89%, Mounjaro’s a mean of 80%, and Trulicity’s 65% and 47% at the two single doses tested — Peptrend scales its curve to the milligrams you logged and applies no injection bioavailability at all. And a published Tmax is one figure standing in for a wide range: 8 to 72 hours is a factor of nine, and your injection is a single draw from whatever distribution produced it.
None of this decides anything for you. The app does not recommend a dose, build a titration schedule, or work out a draw volume — the reconstitution calculator takes vial strength and water and returns mg/mL and stops there, for reasons set out in why a calculator should refuse. The curve is drawn from fields you typed, and what to log with every dose covers which of them the model actually reads; titration and how to chart it covers what happens to the shape when the dose changes. The weight side of the app runs on the same posture of published constants and printed formulas, across the fifteen trend methods.
If a curve in your log does not match the arithmetic above, support is where to say so.
Common questions
Why does the dose curve go up before it comes down?
Because the model gives absorption its own rate constant. A subcutaneous injection sits in the tissue and enters circulation over hours, so the modelled amount climbs while absorption outruns elimination, peaks when the two rates match, and falls afterwards.
When does a GLP-1 dose peak after an injection?
Hours to days, and it depends on the drug. Ozempic's label says maximum concentration is reached 1 to 3 days post dose; Mounjaro's puts tirzepatide at 8 to 72 hours; Trulicity's gives dulaglutide 24 to 72 hours at steady state, with a median of 48. That time to peak is Tmax, and in Peptrend it is the 'Peaks after' stepper, in whole hours, 0 to 120.
How does Peptrend work out the absorption rate constant?
By bisection. Tmax = ln(ka/ke)/(ka − ke) will not rearrange for ka, so the app brackets a range, halves it 80 times, and keeps the value whose implied Tmax matches the setting. The solve runs once per chart series, and every plotted point reuses the result.
Can I turn absorption off?
Yes. Set 'Peaks after' to zero and the stepper reads 'Peaks: immediately'. The expression collapses to A(t) = D × F × e^(−ke·t), the ka → infinity limit, which jumps to the full dose the instant it is logged and only ever falls.
Sources
- OZEMPIC (semaglutide) injection — prescribing information, section 12.3, DailyMed
- MOUNJARO (tirzepatide) injection — prescribing information, section 12.3, DailyMed
- TRULICITY (dulaglutide) injection — prescribing information, section 12.3, DailyMed
- FOUNDAYO (orforglipron) tablets — prescribing information, section 12.3 (revised 7/2026), DailyMed
- Absorption rate constant — Pharmacokinetics reference, University of Lausanne
- Garrett ER. The Bateman function revisited. Journal of Pharmacokinetics and Biopharmaceutics, 1994