How long until a GLP-1 reaches steady state? Four to five half-lives
A weekly GLP-1 reaches steady state after four to five half-lives — 28 to 35 days at the 7.0-day half-life Peptrend ships for semaglutide, 24 to 30 for retatrutide, 20 to 25 for tirzepatide. Until then every injection lands on the residue of the last and the total climbs. The dose card shows that running total as a decayed milligram estimate, never a blood level: 3.33 mg under a 3.5 mg dose.
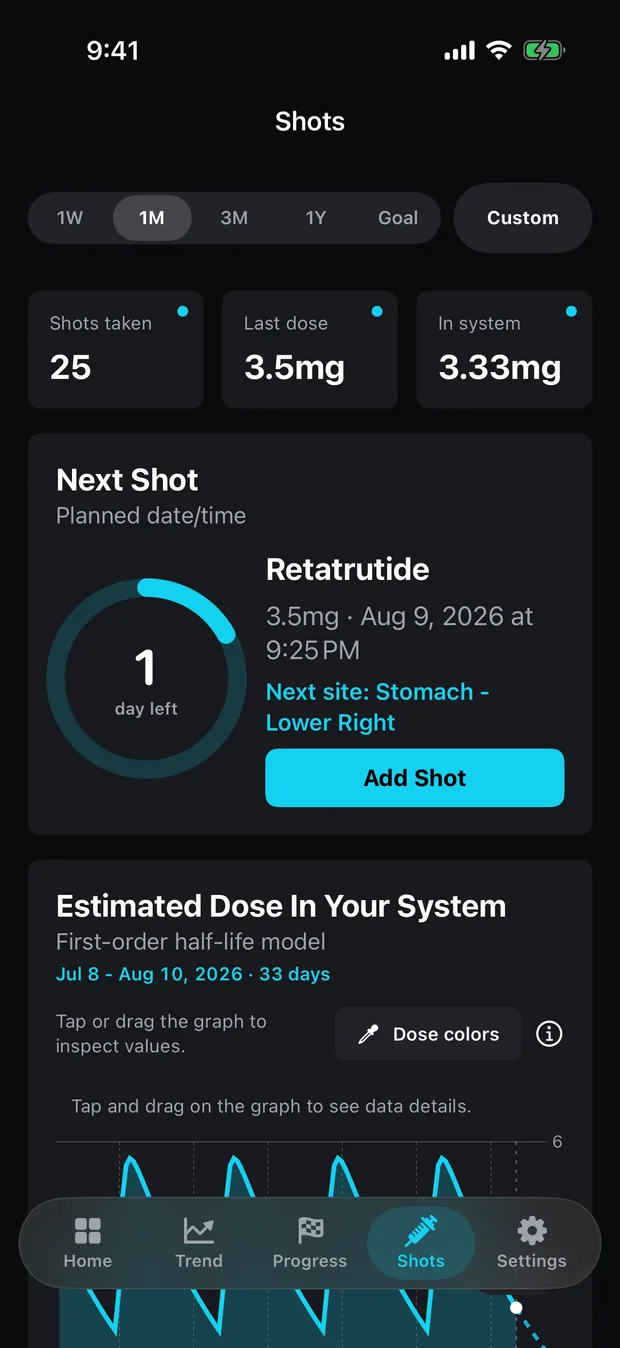
Open the Doses tab in Peptrend’s logged data and the card near the top reads 3.33 mg in system under a last dose of 3.5 mg. Two questions follow from that. Where did the missing 0.17 mg go, and what is the number counting in the first place?
What does “in your system” actually count?
Milligrams. The card is headed “Estimated Dose In Your System”, and the figure behind it is the amount term of a one-compartment model with first-order absorption and first-order elimination:
A(t) = D · F · ka/(ka − ke) · (e^(−ke·t) − e^(−ka·t))D is the logged dose in milligrams, F is bioavailability, ke is the elimination rate constant and ka the absorption rate constant. Add up that expression across every dose of that medication you logged as taken, and you have the number on the card.
What the model does not contain is as important as what it does. There is no volume of distribution, no clearance, no ng/mL. Nothing in the calculation could produce a plasma concentration, and the app says so in its own copy — the info sheet behind the chart calls the number “a simple planning estimate for visualization. It is not a blood concentration model or medical dosing advice”, and the full disclaimer calls the figure a simplified mathematical estimate that “may differ substantially from the actual concentration of any substance in your body”. The word circulating was pulled from the card title for exactly that reason.
How much of a dose survives one dosing week?
Under first-order kinetics the rate of removal is proportional to how much is present, so each day takes the same share of what is left rather than the same quantity. StatPearls puts it plainly: most clinically relevant drugs follow first-order pharmacokinetics, “meaning their drug-elimination rates are directly proportional to plasma concentrations”.
That proportionality is what makes half-life a useful constant. It falls straight out of the rate:
ke = ln(2) / t½Peptrend ships retatrutide at a half-life of 6.0 days. The phase 1b multiple-ascending-dose trial reported its half-life as approximately 6 days and concluded the pharmacokinetics “suggest suitability for once-weekly dosing”. Retatrutide is one of five presets flagged “Not FDA approved, research use only.”, and the app’s own onboarding says the half-lives for those compounds are “the best published estimates, not label values”.
Six days gives ke = 0.1155 per day. Seven days later, e^(−0.1155 × 7) = 0.445. Just under 45% of any given amount survives one dosing week. That fraction is fixed. It applies to 1.2 mg and to 12 mg identically, which is the whole practical value of quoting a half-life instead of a milligram-per-day clearance.
Why do weekly doses stack instead of clearing?
Seven days divided by a 6-day half-life is 1.17 half-lives. The interval is shorter than the drug takes to clear, so the second injection lands on a residue of the first, the third on a residue of both, and the total climbs. StatPearls names the condition directly: accumulation happens when “the dosing interval is shorter than 4 half-lives”.
The climb is a geometric series, and it converges. Ignoring absorption for a moment, the plateau sits at 1 / (1 − e^(−ke·τ)) times the first dose’s contribution — 1.80× for weekly retatrutide. Run the app’s actual model, absorption included, at a flat 3.5 mg once a week and the level just before each next dose goes:
| After dose | Half-lives elapsed | Level just before next dose | Share of final plateau |
|---|---|---|---|
| 1 | 1.17 | 1.61 mg | 55% |
| 2 | 2.33 | 2.33 mg | 80% |
| 3 | 3.50 | 2.65 mg | 91% |
| 4 | 4.67 | 2.79 mg | 96% |
| 5 | 5.83 | 2.86 mg | 98% |
| 8 | 9.33 | 2.90 mg | 100% |
Four doses in, the model is within 4% of where it will ever get. The same arithmetic drives weekly versus daily dosing: shorten the interval relative to the half-life and the plateau rises while the week-to-week swing flattens.
How long until steady state? Four to five half-lives
The rule of thumb is four to five half-lives to steady state, and StatPearls states both forms of it — “approximately 4 to 5 half-lives” in one article, “approximately 5 half-lives” in the other. A real label agrees. Ozempic’s prescribing information says semaglutide has an elimination half-life of about 1 week, will be present in circulation for about 5 weeks after the last dose, and reaches steady-state exposure “following 4 to 5 weeks of once-weekly administration”.
Multiply that out across the half-lives Peptrend ships as presets:
| Medication | Half-life in the app | 4 half-lives | 5 half-lives |
|---|---|---|---|
| Semaglutide (injection) | 7.0 days | 28 days | 35 days |
| Retatrutide | 6.0 days | 24 days | 30 days |
| Tirzepatide | 5.0 days | 20 days | 25 days |
| Liraglutide | 0.55 days (~13.2 h) | 2.2 days | 2.75 days |
The clock restarts at every step of a titration. Going from 3.0 mg to 3.5 mg is a new plateau to climb, and it takes the same four or five half-lives to get there — which is why a ramp read on a chart looks like a staircase with rounded corners rather than a jump. Peptrend charts that shape but does not design it: see titration and how to chart it for what the Dose Over Time view does and does not do.
Why does one dose never reach its own milligram count?
The ka term flattens the top of every dose. Peptrend solves ka numerically from the preset’s published Tmax by bisecting Tmax = ln(ka/ke) / (ka − ke). Retatrutide’s Tmax is 24 hours, which gives ka ≈ 3.54 per day — an absorption half-life near 4.7 hours.
Elimination is running the entire time absorption is. So a single 3.5 mg dose, alone in an empty system, peaks at about 3.12 mg at the 24-hour mark — 89% of the milligrams injected — and falls from there. Set absorption to zero hours and the expression collapses to A(t) = D · F · e^(−ke·t), which does peak at the full dose the instant it is logged. The curve’s leading edge is the part reading the absorption curve covers in detail.
Six days after a 3.5 mg dose, the card reads 3.33 mg
Take a clean schedule — weekly retatrutide stepping 1.2 mg → 2.0 mg → 3.0 mg → 3.5 mg, one injection every seven days. Nobody’s real log looks like that, including the one this site charts, where the doses run 1.0 to 3.6 mg at gaps from four to thirty-five days and step back down partway through. An even ladder is the right thing to reason with anyway, because it isolates what the model does from what an irregular schedule does to it.
Feed that ladder through the model above and 3.33 mg is where the curve sits roughly six days after the final 3.5 mg injection. Decompose it:
- A little over half — about 1.85 mg — is the most recent 3.5 mg dose, six days into its own decay.
- The remainder — just under 1.5 mg — is the tail of everything logged before it, dominated by the previous week’s dose.
So the card is not showing a shrunken version of the last injection. It is showing a running total that happens, at this point in the dosing week, to land just below one dose’s worth. Hold that 3.5 mg weekly schedule long enough to settle and the model swings between roughly 5.7 mg about a day after an injection and 2.9 mg just before the next one, a factor of about two, week after week. Read the card without checking where you are in that cycle and you will read it wrong.
Can you change the half-life the app uses?
Half-life is yours to set: the control accepts 0.05 to 30 days, with a step that widens as the value grows. Eleven medication presets ship with a half-life, a Tmax and a bioavailability, plus a “Something else” option, and the dose info sheet lists the FDA labels and published trials behind those figures rather than asking you to take them on faith. The medication pages set each approved preset beside its label and chart the curve it draws.
What the app refuses to do is the other half of the story. It will not compute a draw volume, recommend a dose, or tell you when to step up — the reconstitution calculator takes vial strength in mg and water in mL and returns mg/mL, and stops there. That refusal is deliberate and permanent; why a calculator should refuse explains the reasoning.
Everything above is arithmetic on a published constant, which is the same posture the weight side of the app takes — an exponential decay applied to weigh-ins instead of doses, described in EWMA explained for weigh-ins and across the fifteen trend methods. If something here does not match your data, support is the place to say so.
Common questions
How long does it take to reach steady state on a weekly GLP-1?
Roughly four to five half-lives. At the half-lives Peptrend ships — 7.0 days for semaglutide, 6.0 for retatrutide, 5.0 for tirzepatide — five half-lives is 35, 30 and 25 days, and four is 28, 24 and 20. The Ozempic label says the same thing in weeks: steady-state exposure after 4 to 5 weeks of once-weekly dosing.
How long does semaglutide stay in your system after the last dose?
Ozempic's prescribing information gives semaglutide an elimination half-life of about 1 week and says it is present in circulation for about 5 weeks after the last dose. Peptrend ships 7.0 days for the injection, so five half-lives is 35 days. The tail is slow because each week clears a fixed percentage of what is left, never a fixed number of milligrams.
Why does the app show less than my last dose?
Because the figure is a sum that has been decaying since each injection went in, and because the model absorbs a dose over hours rather than instantly. A 3.5 mg retatrutide dose peaks in the model at about 3.12 mg, 24 hours in, and is down near 1.6 mg a week later.
Is the 'in your system' figure a blood concentration?
No. It is milligrams. There is no volume of distribution, no clearance term and no ng/mL anywhere in the calculation. Peptrend's own disclaimer calls it a simplified mathematical estimate that may differ substantially from the actual concentration of any substance in your body.
Sources
- Hallare J, Gerriets V. Elimination Half-Life of Drugs. StatPearls, NCBI Bookshelf
- Wadhwa RR, Cascella M. Steady State Concentration. StatPearls, NCBI Bookshelf
- Urva S et al. LY3437943, a novel triple GIP, GLP-1, and glucagon receptor agonist: phase 1b multiple-ascending dose trial. Lancet, 2022
- OZEMPIC (semaglutide) injection — prescribing information, section 12.3, DailyMed