Does oral semaglutide have the same half-life as the injection?
Near enough: Peptrend ships 6.5 days for the tablet and 7.0 for the injection, so both take about three weeks to plateau. What differs is the gap between doses. Oral semaglutide arrives every 0.15 half-lives and ripples about 10% across a day; weekly retatrutide arrives every 1.17 and runs 5.74 mg down to 2.91 mg. Tablets also enter the model at their bioavailability: 14 mg counts as 0.11 mg.
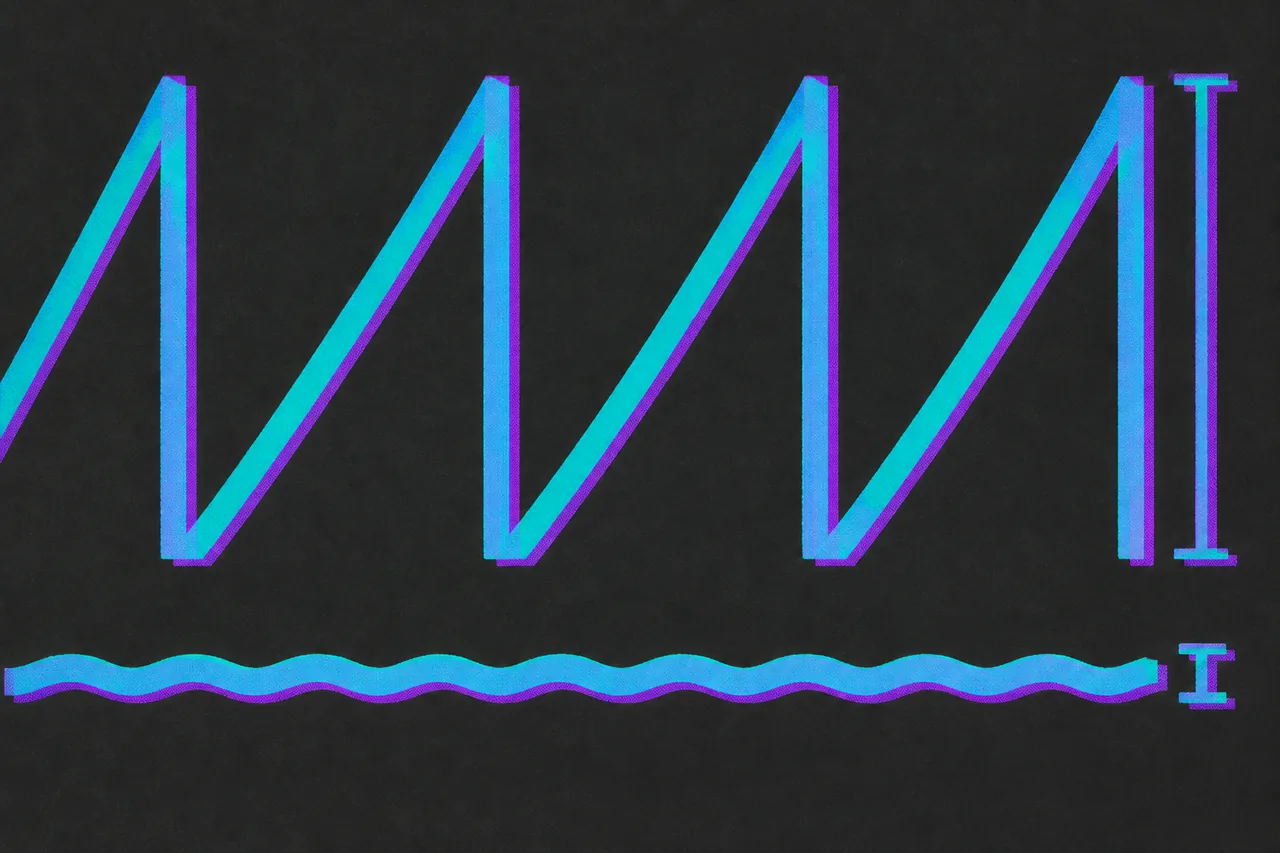
Log a year of weekly injections and the dose chart draws a row of teeth. Log a year of daily tablets and it draws something close to a straight line with a ripple on it. Same model, same code path. The difference is one ratio.
What decides whether the curve sawtooths or flattens?
The shape of an accumulation curve depends on the gap between doses measured in half-lives, not in days. Call the gap τ and the half-life t½. Then the share of the level that survives one dosing gap is 2^(−τ/t½), and everything else follows from it.
Two numbers come out of that fraction. Accumulation ratio — how much higher the plateau sits than a single dose alone would leave — is 1 / (1 − 2^(−τ/t½)). Peak-to-trough ratio, the depth of one tooth, is 2^(τ/t½) for a dose that arrives all at once. They pull in opposite directions. Shrink the interval and the plateau rises while the tooth flattens.
Here are the seven GLP-1 presets at the intervals they ship with, run through Peptrend’s own two-rate model at a flat repeating dose:
| Preset | Route | Half-life | Interval | τ ÷ t½ | Accumulation ratio | Peak ÷ trough | Swing about the mean |
|---|---|---|---|---|---|---|---|
| Semaglutide (tablet) | oral | 6.5 d | 1 d | 0.15 | 9.89 | 1.11 | 10% |
| Orforglipron, the 1.4.0 preset | oral | 1.6 d | 1 d | 0.63 | 2.84 | 1.39 | 32% |
| Semaglutide (injection) | injection | 7.0 d | 7 d | 1.00 | 2.00 | 1.61 | 45% |
| Retatrutide | injection | 6.0 d | 7 d | 1.17 | 1.80 | 1.97 | 65% |
| Tirzepatide | injection | 5.0 d | 7 d | 1.40 | 1.61 | 2.25 | 77% |
| Dulaglutide | injection | 5.0 d | 7 d | 1.40 | 1.61 | 1.89 | 59% |
| Liraglutide | injection | 0.55 d | 1 d | 1.82 | 1.40 | 1.74 | 51% |
The accumulation column is the textbook figure for instant absorption. The peak-to-trough column is simulated with the app’s absorption term switched on, which is why every entry in it sits below its own 2^(τ/t½). Retatrutide is one of five presets flagged “Not FDA approved, research use only.” The orforglipron row is the preset as 1.4.0 sets it, from that drug’s FDA label; versions through 1.3.3 run a 2.3-day half-life there instead, for 0.43, a 3.84 accumulation ratio and a 26% swing.
How far does the level fall before the next weekly dose?
At the app’s retatrutide defaults — 6.0-day half-life, 24-hour time to peak — a steady 3.5 mg once a week settles into a cycle that runs from 5.74 mg about 20 hours after the injection down to 2.91 mg just before the next one. That is a ratio of 1.97, and it repeats for as long as you keep dosing.
Absorption is what keeps it under the ideal. The instant-absorption arithmetic says 2^(7/6) = 2.24; the modelled tooth is shallower because the dose takes a day to finish arriving, and the climb overlaps the fall of everything already in the system. Tirzepatide and dulaglutide make that visible in one line each: identical 5-day half-lives, identical 7-day intervals, and teeth of 2.25 against 1.89, because their time-to-peak settings differ — 24 hours versus 48.
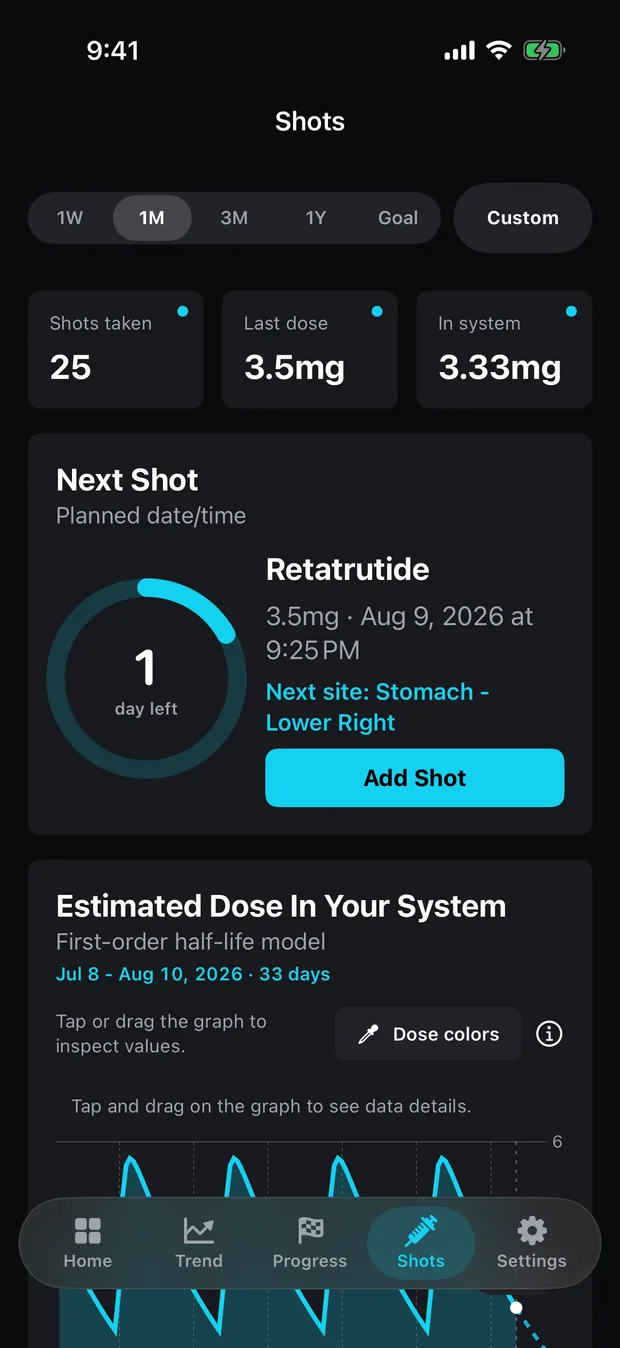
So the number on the card means nothing without a position in the cycle. Peptrend’s log reads 3.33 mg in system under a last dose of 3.5 mg, which sits in the lower half of the week; read the same log two days after an injection and it reads far higher. How long a GLP-1 takes to reach steady state decomposes that figure dose by dose.
What does a daily tablet’s curve look like?
Shorten the interval to a day and the tooth collapses. Oral semaglutide’s 6.5-day half-life against a 1-day interval gives τ ÷ t½ = 0.15, so roughly 90% of the level survives to the next dose and the refill nearly cancels the loss. The modelled swing is 10% about the mean, which reads on screen as a faint ripple along a rising line.
At a 14 mg tablet once daily, that is a level moving between 1.10 mg and 1.00 mg across each 24 hours. A tenth of a milligram of visible variation, on a curve whose vertical span is dominated by the climb to plateau.
Orforglipron sits between the two, and its half-life is why. The preset in 1.4.0 runs a 1.6-day half-life against a daily interval, so τ ÷ t½ is 0.63, the accumulation ratio 2.84× and the modelled swing 32% — visible teeth, about half as deep as retatrutide’s 65%. That 1.6 days is 38.4 hours, the midpoint of the 29-to-49-hour elimination half-life the Foundayo label gives for an oral dose, and the label names no typical value inside that range.
Versions through 1.3.3 built the preset from a phase 1a study instead, published before the drug had a label. That study dosed healthy participants and reported a mean terminal half-life of 24.6 to 35.3 hours after a single dose, rising to 48.1 to 67.5 hours by day 28; those versions carry 2.3 days, 55 hours, inside that day-28 range, which gives 0.43 and a 26% swing. A curve drawn under the older preset is not comparable with one drawn under 1.4.0, and nothing rescales a history logged before the change.
Does a daily tablet reach steady state any faster?
Time to plateau is set by the half-life alone. The interval changes how the line ripples on its way up and never changes how long the climb takes, because the plateau is approached as 1 − e^(−ke·t) regardless of how the doses are spaced. StatPearls gives the rule of thumb as roughly five half-lives.
Run that on the presets and the two shapes finish together:
| Preset | Half-life | 90% of plateau | 95% of plateau |
|---|---|---|---|
| Semaglutide (tablet), daily | 6.5 d | 21.6 d | 28.1 d |
| Retatrutide, weekly | 6.0 d | 19.9 d | 25.9 d |
| Orforglipron, daily, the 1.4.0 preset | 1.6 d | 5.3 d | 6.9 d |
Three weeks either way for the two 6-ish-day drugs, one flat line and one row of teeth. The Rybelsus and Ozempic labels agree on the point: both say steady-state exposure arrives after 4 to 5 weeks, one for a daily tablet and one for a weekly injection. Every step of a titration restarts that clock at a new plateau, which is why a ramp reads as a staircase with rounded corners — titration and how to chart it covers what the Dose Over Time view does with a real escalation.
Why doesn’t a 14 mg tablet count as 14 mg?
Bioavailability is the fraction of an administered dose that reaches systemic circulation in active form. StatPearls states the absolute version as F = AUC for the route ÷ AUC for intravenous, with intravenous fixed at 100% by definition, and names intestinal absorption and hepatic first-pass metabolism as the reason oral routes fall short.
For a peptide taken by mouth, “fall short” is an understatement. The Rybelsus label puts the absolute bioavailability of oral semaglutide at approximately 0.4% to 1% across the 3, 7 and 14 mg tablets, and at 1% to 2% for the 1.5, 4 and 9 mg strengths the same label covers, which it says are not interchangeable with the first three milligram for milligram. Overgaard and colleagues, modelling six clinical pharmacology trials in Clinical Pharmacokinetics in 2021, put it at 0.8% under the recommended dosing conditions — the same paper that found post-dose fasting time, the volume of water swallowed with the tablet, and body weight to be the covariates that moved exposure most.
Set that beside the injection. Ozempic’s label reports the absolute bioavailability of subcutaneous semaglutide as 89%. Same molecule, two routes, a hundredfold gap.
How the app applies bioavailability to a mixed history
The app multiplies each logged dose by a bioavailability fraction before it enters the decay model, and it reads the route off the dose rather than off your current medication setting:
func absorbedMg(oralBioavailability: Double) -> Double {
    route == .oral ? dosageMg * oralBioavailability : dosageMg
}
Per dose, because histories are mixed. Somebody who moved from an injection to a tablet has both eras under one medication name, and scaling the injection era down by 0.008 would erase it. Every injection preset carries F = 1.0; only the two oral presets carry a real fraction: 0.008 for semaglutide tablets, and for orforglipron 0.77 in 1.4.0, against 0.35 in versions through 1.3.3.
The route test is deliberately lopsided: anything that is not literally the string “oral” reads as an injection. Both directions of error cost the same factor, 1 ÷ 0.008 = 125, and they fail very differently. A tablet read as an injection draws a curve 125 times too high, which nobody can miss. An injection read as a tablet draws one 125 times too low and quietly flattens a year of real data. The default falls on the side of the loud failure.
The interface changes in two places when the fraction drops below 1. The dose card retitles itself from “Estimated Dose In Your System” to “In Your System”, and its info sheet spells out the arithmetic in your own numbers — at 0.8%, “a 14mg tablet contributes about 0.11mg”. What to log with every dose covers the rest of what the route decides, including the three fields that disappear.
Where does orforglipron’s absorbed fraction come from?
From the drug’s FDA label, as of 1.4.0. That label reports a geometric mean absolute bioavailability of 77% for orforglipron, measured at the 0.8 mg dose, with no clinically relevant food effect, and 0.77 is what the preset carries. Versions through 1.3.3 carry 0.35 instead, from a source comment reading “30–40%, and no food or water restrictions” — a fair read of the phase 1 literature before anyone measured the fraction directly.
Measuring it directly came later. Morse and colleagues, reporting two phase 1 open-label studies in Clinical Pharmacology in Drug Development, found a mean absolute oral bioavailability of 79.1% ± 16.8% for orforglipron in 10 healthy adults, each given a 1 mg oral capsule while fasting against an intravenous microdose of radiolabelled drug. The label’s 77% sits inside that spread, and both are more than twice the older preset’s 35%. Orforglipron is a non-peptide agonist, which the phase 1a authors say can be dosed without the food and water restrictions an oral peptide needs. The stepper is right there under either preset: Settings → Medication, route Oral, Absorbed: N% of each dose, 0.1% to 100% in tenths of a point.
Variability is the caveat under all of it. Overgaard and colleagues’ population model of oral semaglutide — fitted to six clinical pharmacology trials in healthy volunteers and in subjects with renal or hepatic impairment, then re-estimated on a trial in subjects with type 2 diabetes — put the within-subject variability of bioavailability at 137%: same dose, same person, wildly different days. The daily interval is what rescues the picture. With a week-long half-life smoothing across doses, the same paper reports that per-dose variation collapses to about 33% within-subject variability in steady-state exposure. Every figure in this section describes a drug as trials measured it, not anything the app can see in your log. Frequent dosing flattens the noise for the same reason it flattens the sawtooth.
Does the dose interval setting change the curve?
The interval setting never shapes the curve. It drives the next-dose date, the countdown ring and the one local reminder, and nothing else; the chart is built from the timestamps on the doses you actually logged, so an irregular real schedule draws an irregular curve. Set the interval to a day or less and the ring switches from days to hours.
Resolution follows the range you pick: a 6-hour grid on the 1-week and 1-month ranges, a 1-day grid beyond that, capped at 240 points, then a projection running 6-hourly for a week and 12-hourly after, out to ten half-lives — 65 days past today for a 6.5-day tablet. The leading edge of every hump is covered in when a dose peaks after an injection.
None of it decides anything for you. The app does not recommend a dose, build a titration schedule, or work out a draw volume — the reconstitution calculator takes vial strength and water and returns mg/mL, for the reasons in why a calculator should refuse. The weight side runs on the same posture of published constants and printed formulas, from EWMA on your weigh-ins through the fifteen trend methods.
The “in your system” figure is a decayed milligram estimate built from a published half-life, never a blood or plasma concentration, and it may differ substantially from the actual amount of any substance in your body. If a curve in your log does not match the arithmetic above, support is where to say so.
Common questions
Why does a daily GLP-1 tablet show a flatter line than a weekly injection?
Because the gap between doses is a smaller share of the half-life. A weekly retatrutide injection lands every 1.17 half-lives, so roughly 55% of the level is gone before the next dose arrives. A daily semaglutide tablet lands every 0.15 half-lives, so about 10% is gone. The refill keeps pace with the loss, and the sawtooth shrinks to a ripple.
Does a flatter curve mean a daily tablet reaches steady state faster?
No. The half-life sets the time to plateau and the interval never enters it. At the values Peptrend ships, a 6.5-day semaglutide tablet is 90% of the way there after 21.6 days and a 6-day retatrutide injection after 19.9 days — near enough the same, one curve flat and one a row of teeth.
How much of an oral semaglutide tablet is actually absorbed?
Very little of a swallowed peptide reaches circulation. The Rybelsus label puts the absolute bioavailability of oral semaglutide at approximately 0.4% to 1%. Peptrend ships 0.8% for that preset, so a 14 mg tablet enters the model at 0.11 mg. Counting the swallowed milligrams whole would put the curve 125 times too high.
Can I change the absorbed fraction?
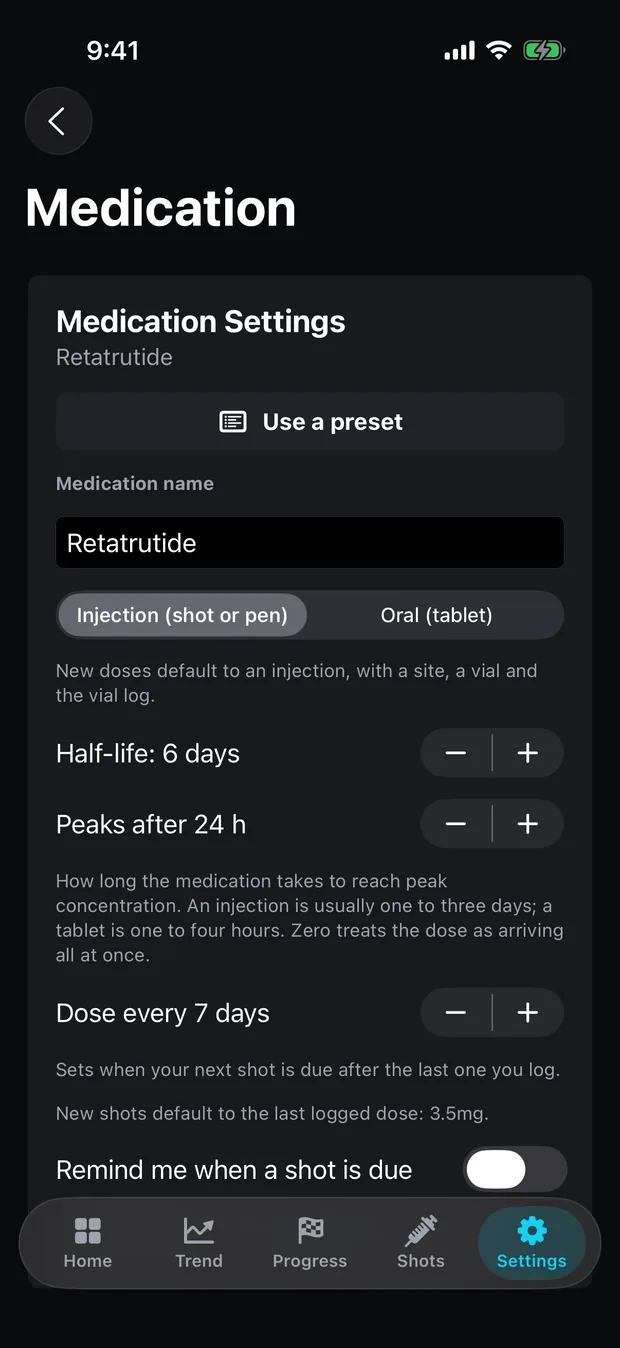
Yes, whenever the route is set to Oral. The stepper reads 'Absorbed: N% of each dose' and accepts 0.1% to 100% in tenths of a point. Applying a medication preset overwrites it along with the half-life, the time to peak and the interval, so the app asks first and lists what it will change.
Sources
- RYBELSUS (semaglutide) tablets — prescribing information, section 12.3, DailyMed
- OZEMPIC (semaglutide) injection — prescribing information, section 12.3, DailyMed
- Overgaard RV et al. Clinical Pharmacokinetics of Oral Semaglutide: Analyses of Data from Clinical Pharmacology Trials. Clinical Pharmacokinetics, 2021
- Price G, Patel DA. Drug Bioavailability. StatPearls, NCBI Bookshelf
- FOUNDAYO (orforglipron) tablets — prescribing information, section 12.3 (revised 7/2026), DailyMed
- Pratt E et al. Orforglipron (LY3502970): a Phase 1a single- and multiple-ascending-dose study. Diabetes, Obesity and Metabolism, 2023
- Morse BL et al. Disposition and Absolute Bioavailability of Orally Administered Orforglipron in Healthy Participants. Clinical Pharmacology in Drug Development, 2026
- Wadhwa RR, Cascella M. Steady State Concentration. StatPearls, NCBI Bookshelf