
How many weigh-ins before a weight trend means anything?
More than two weeks' worth. On one user's log, a 14-day window held a median of six readings, and the default trend line's weekly rate showed a gain in 27% of those windows across a period that lost 22.0 lb overall. At 28 days that fell to 19%, and a straight-line fit through the raw readings showed a gain in 5%. Every method starts from your first reading, so the first weeks lean on it.
A new log is a handful of readings and a line drawn through them. The line appears from the first weigh-in, and so does a weekly rate. Neither means much yet, and the honest way to say how long “yet” lasts is to cut a real log into short pieces and see how often the short pieces tell the wrong story.
What does a trend line do with only a few readings?
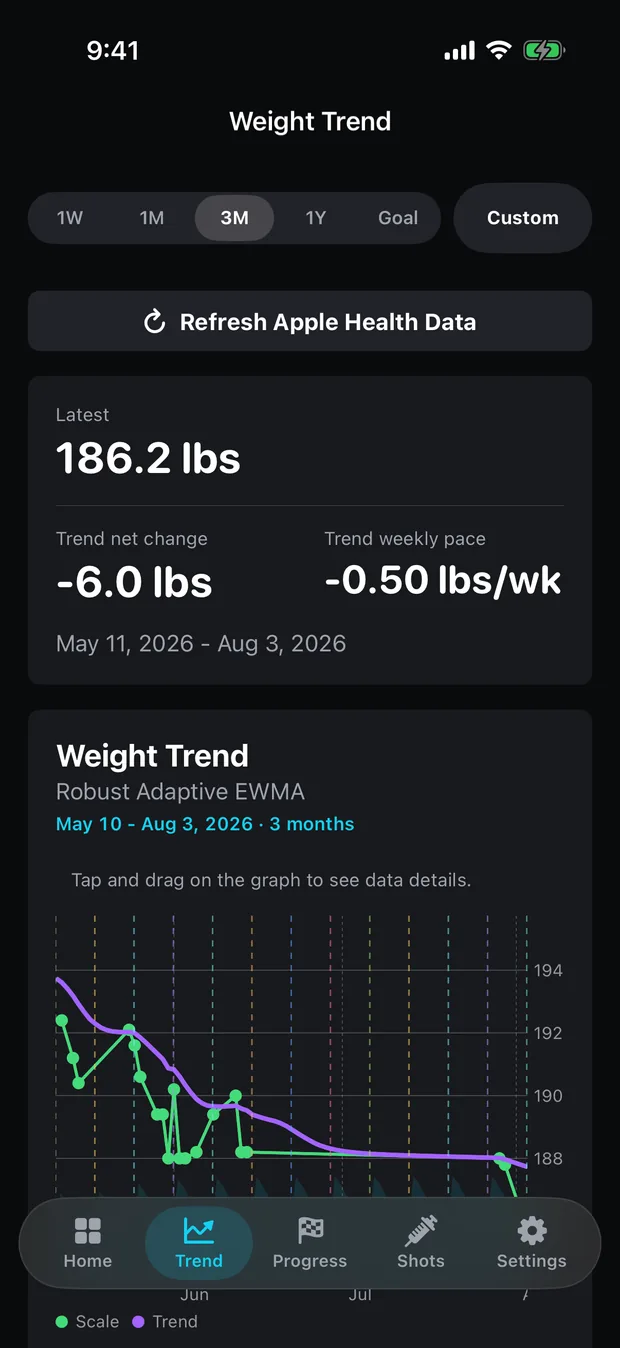
It starts at the first one. Peptrend’s exponential methods, the default Robust Adaptive EWMA among them, set the line’s first value to your first weigh-in and move it a fraction of the way toward each reading after that. On one user’s log the first reading was 205.0 lb and so was the first point of the line. For the first week or two, then, the line is mostly your starting weight with some of the newer readings mixed in.
The weekly rate has its own warm-up. The app computes it as the change in the trend line over the last seven days. Before the log has seven days in it, there is no week to look back across, so it takes the change between the last two days and scales it up to a week. One noisy day can then read as a rate of several pounds a week.
Two other guards exist. The Progress tab’s rate needs at least three days between the first and last reading in the window, and returns nothing until it has them. Weekly Average needs two calendar weeks before it can report any rate at all.
How often does a short stretch point the wrong way?
Often, on this log. It holds 84 weigh-ins over 225 days, with a net change of −22.0 lb. Taking every possible starting day, the table cuts it into stretches of 7, 14, 28 and 56 days and reports two rates for each stretch: the default trend line’s seven-day look-back at the end of it, and an ordinary least-squares slope through the raw readings in it. “Gain” is the share of stretches whose rate came out positive.
| Stretch | Readings (median) | Default trend rate, middle 90% | Showed a gain | Least-squares rate, middle 90% | Showed a gain |
|---|---|---|---|---|---|
| 7 days | 4 | −2.19 to +1.51 lb/wk | 30% | −6.30 to +3.03 lb/wk | 29% |
| 14 days | 6 | −2.09 to +0.68 lb/wk | 27% | −3.97 to +0.79 lb/wk | 22% |
| 28 days | 11 | −1.38 to +0.34 lb/wk | 19% | −2.11 to 0.00 lb/wk | 5% |
| 56 days | 20 | −1.18 to +0.14 lb/wk | 16% | −0.87 to −0.11 lb/wk | 1% |
Across a period that fell by 22.0 lb, more than a quarter of two-week stretches had a trend line that said the weight was rising. That is not a fault in the method. A fortnight of real change on this log is about the size of one ordinary morning’s swing, so the readings cannot tell the two apart yet.
Why do the two rates settle at different speeds?
Because they answer different questions. The least-squares slope uses every reading in the stretch with equal say, and its uncertainty shrinks quickly as the stretch lengthens: by 56 days only 1% of stretches came out positive. Its weakness is the short end, where a 7-day slope through four readings ranged from −6.30 to +3.03 lb a week.
The default trend’s rate is a seven-day look-back on a smoothed line, so it never looks across more than a week of that line, whatever the stretch length. It is calmer at the short end and slower to settle at the long end, and it reads closer to zero than the slope: at 14 days its median was −0.36 lb a week against the slope’s −0.74. That gap is lag, the line still carrying older readings. Why your trend line lags covers where it comes from.
Which readings in a new log matter most?
The first ones, and then the steady ones. Because the line starts at your first weigh-in, a first reading taken after a salty dinner or a long flight sits in the line for days. And gaps hurt more early on: this log’s mean gap between readings is 2.7 days, which is why a 14-day window held a median of six readings rather than fourteen.
Daily readings shorten the wait more than anything else does. The signal-to-noise post works out how many days of daily weigh-ins a fitted rate needs before its error band clears zero on this log, and interpolation covers what the line does across the days you skip.
What does the app show while the log is short?
Everything, from the first reading, and it does not hide early figures behind a warning. That puts the judgement with you:
- The first two weeks: read the dots, not the line, and treat the weekly rate as noise. More than a quarter of fortnights on this log pointed the wrong way.
- Around four weeks: the line’s direction starts to mean something. The raw least-squares rate, which the Progress tab shows free as Scale Actual Rate, came out positive in 5% of 28-day windows here.
- Eight weeks and on: the rates settle, and the differences between methods start to matter more than the noise. Choosing a trend method compares them.
None of these thresholds is a rule. They are what one person’s log did, offered to show the size of the problem rather than to predict anyone else’s. The smoothed line and its weekly pace are Pro; the raw readings and the Scale tab chart are free. The methods page has the formula behind each line.
Common questions
How long before a weight trend line is reliable?
On one user's log, a fortnight was not enough: the default trend's weekly rate showed a gain in 27% of 14-day windows across a period that lost weight overall. Four weeks cut that to 19%, and eight weeks to 16%. A straight-line fit through raw readings settled faster.
What does the trend line show on day one?
Your first weigh-in. The exponential methods start the line at the first reading and move it from there, so for the first week or two the line leans heavily on where you started.
Why does the weekly rate jump around in the first week?
Before a log has seven days in it, the app cannot look back a full week, so it scales the change between the last two days up to a weekly figure. One noisy day then reads as a large weekly rate.
Sources
- Simple linear regression — standard error of the estimated slope
- NIST/SEMATECH e-Handbook of Statistical Methods, 6.4.3.1 Single Exponential Smoothing
- Schneditz et al., 'Day-to-day variability in euvolemic body mass', Renal Failure 45(2), 2023 — 9,521 standardised daily measurements
- John Walker, The Hacker's Diet — Signal and Noise