Semaglutide injection half-life, time to peak and level curve
Injected semaglutide has an elimination half-life of about one week, and its FDA label puts the peak 1 to 3 days after a dose. Peptrend's preset uses 7 days and 48 hours. In the app's model one dose climbs to 82.0% of the logged amount at 48 hours, then falls at the half-life, so 53.7% is left when the next weekly dose is due. Repeated weekly, the level settles within 28 to 35 days, between 172.7% and 107.4% of one dose.
The preset's numbers, beside its source
What the Semaglutide (injection) preset writes into Settings › Medication, beside what the FDA label says. The sources at the foot of the page name what the app itself cites.
| Constant | Peptrend preset | FDA label |
|---|---|---|
| Half-life | 7 days | Approximately 1 week |
| Time to peak (Tmax) | 48 hours | 1 to 3 days after a dose |
| Bioavailability | 100%, every logged milligram | 89% (absolute) |
| Dosing interval | Every 7 days | Once weekly |
| Time to steady state | 28 to 35 days (4 to 5 half-lives) | After 4 to 5 weeks of once-weekly dosing |
The curve the model draws
Both curves are Peptrend's own model run on the four numbers above and scaled to one logged dose, so they carry no dose amount. Each point is a decayed-milligram estimate built from a published half-life and time to peak. The model has no volume of distribution, so it cannot give a blood or plasma concentration. The curves describe semaglutide as this preset models it, and describe no effect of the app and no person's result.
| Model quantity | Value for this preset |
|---|---|
| Elimination rate, ke = ln 2 ÷ half-life | 0.0990 per day |
| Absorption rate, ka, solved from Tmax | 1.44 per day |
| One dose at its peak | 82.0% of the logged dose, at 48 hours |
| One dose, one interval later | 53.7% of the logged dose |
| Accumulation ratio, 1 ÷ (1 − e^(−ke·τ)) | 2.00× |
| Settled peak and trough | 172.7% and 107.4% of one logged dose |
What does the label say about semaglutide’s half-life and peak?
Injected semaglutide, sold as Ozempic and Wegovy, has an elimination half-life of approximately one week, according to the prescribing information Peptrend cites. The same section puts maximum concentration 1 to 3 days after a dose, gives the absolute bioavailability as 89%, and says steady-state exposure follows 4 to 5 weeks of once-weekly administration. It adds that semaglutide stays present for about 5 weeks after the last dose.
The preset turns that into four numbers. Seven days is the label’s week, taken literally. Forty-eight hours is the middle of the label’s 1-to-3-day window, one pick from a range the label reports as wide. The interval is the label’s weekly schedule.
The fourth number is where the preset departs from the label on purpose. Every injection preset in the app uses a bioavailability of 100%, so the model counts each logged milligram whole. The last section below says what that costs.
What does one dose look like in the model?
One dose starts at zero, climbs for two days, and turns over at 82.0% of the logged amount. It never reaches 100%, because elimination runs the whole time absorption does. A dose that takes 48 hours to peak arrives with 48 hours of decay already spent, and in this model the peak lands at exactly e^(−ke·Tmax) of the dose.
From there the curve falls at the half-life. Seven days after the injection, when the next weekly dose is due, 53.7% is left. The interval and the half-life are the same length, which makes semaglutide the easiest of the six presets to reason about: each weekly dose finds a little over half of the previous one still in the model.
The absorption rate behind the climb is solved rather than published. The app searches for the ka that makes Tmax = ln(ka/ke)/(ka − ke) come out at 48 hours, by bisection, and lands on 1.44 per day, an absorption half-life of about 11.6 hours. Reading the absorption curve walks through the solve.
What happens when weekly doses repeat?
Weekly doses stack until the amount cleared each week equals one dose. With a 7-day half-life and a 7-day interval, half the level clears between doses, so the settled trough is twice what a single dose leaves after a week. In the model the level settles between 172.7% of one logged dose at its highest and 107.4% just before the next injection.
Getting there takes four to five half-lives, 28 to 35 days, which matches the label’s own 4 to 5 weeks. The shaded band on the repeated-dose chart marks that window. Four doses in, the level just before each injection is within about 6% of where it settles.
The rule restarts at every change. A different dose is a different plateau, and the model takes the same four or five half-lives to reach it, which is why a titration charted in the app reads as a staircase with rounded corners. How long a GLP-1 takes to reach steady state works the same arithmetic on a weekly schedule.
Where does the model part from the label?
The app’s curve departs from the label in three places.
- Bioavailability. The label reports 89% and the model uses 100%. That lifts the whole curve about 12% above where the label’s figure would put it, and leaves its shape alone.
- Time to peak. 48 hours is one value from a range of 24 to 72. A dose that peaked at 24 hours would top out near 91% of the logged amount in this model, and one at 72 hours near 74%.
- People differ. A label half-life is a population figure. The model applies one number to every dose, and nothing in the app measures how fast any one person clears the drug.
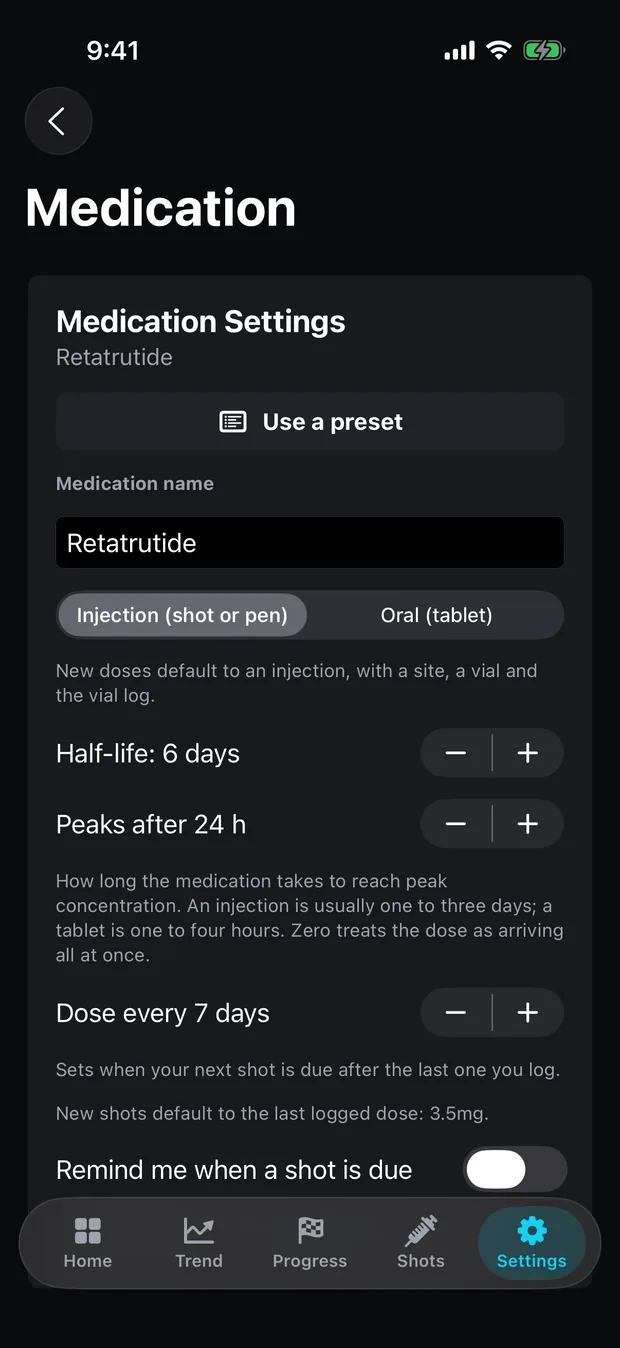
Both semaglutide presets write the medication name Semaglutide, and each logged dose keeps its own route. A switch from the pen to the tablet therefore stays one curve: with the tablet preset applied, the earlier injections still count whole and each tablet counts at 0.8%. The oral semaglutide page covers the tablet. Every constant is editable in Settings › Medication, and the app asks before a preset overwrites them.
How Peptrend logs semaglutide
With the Semaglutide (injection) preset applied from Use a preset in Settings › Medication, each shot logged on the Shots tab carries a date and time and a dose in milligrams, with the injection site, vial and pain score optional. The model above runs over every taken dose logged under the name Semaglutide.
The arithmetic behind these curves
- How long until a GLP-1 reaches steady state? Four to five half-lives
- When does a GLP-1 peak after injection? Tmax and the absorption curve
- Does oral semaglutide have the same half-life as the injection?
- Every medication preset, side by side
Other presets: Semaglutide (tablet) · Tirzepatide · Dulaglutide · Liraglutide · Orforglipron
Sources
- OZEMPIC (semaglutide) injection — prescribing information, section 12.3 (revised 5/2026), DailyMed — FDA label, cited in the app
- Min JS et al. A Comprehensive Review on the Pharmacokinetics and Drug-Drug Interactions of Approved GLP-1 Receptor Agonists and a Dual GLP-1/GIP Receptor Agonist. Drug Design, Development and Therapy, 2025 — Review, cited in the app
- Wadhwa RR, Cascella M. Steady State Concentration. StatPearls, NCBI Bookshelf