Why active energy falls when your training has not changed
Active energy measures the work of moving your body, and lighter bodies cost less to move. In one study of women who lost 21% of their body weight, the energy cost of walking fell by more than the weight loss alone predicted. A falling line can therefore describe a smaller body doing identical training, which is why exercise minutes is the better read.
Active energy is an estimate of the work of moving your body around, and the work of moving a body depends on how much of it there is. Walk the same route at the same pace twenty pounds lighter and the figure your watch reports will be smaller, because the task genuinely was smaller. Nothing about your effort or your training has to have changed for the line to fall.
What the two movement metrics count
Eight of the ten metrics on the Athlete tab average a day’s samples. Exercise minutes and active energy are the two exceptions, and they are added up instead. Averaging them would report the mean length of a workout rather than how long you trained, which is a different question and a less useful one.
The app describes them in a sentence each. Exercise minutes is “Minutes your watch counted as exercise that day, added up.” Active energy is “Calories burned through movement that day, added up.”
The distinction matters more than it looks. One counts time, and time is the same regardless of who spends it. The other counts energy, and energy scales with the mass being moved. Two people doing identical hour-long walks record identical exercise minutes and different active energy. The same person, months apart, at different weights, is in the same position.
The measured size of the effect
Foster and colleagues measured this directly in 1995, in eleven women with obesity. They measured standing energy expenditure and subtracted it from the total energy cost of walking to isolate ambulatory energy expenditure, the part attributable to the walking itself, which accounted for 80% of the total. Measurements were taken at baseline, at week 9, and at week 22 after two weeks of weight stability.
| Point | Weight change | Ambulatory energy expenditure |
|---|---|---|
| Week 9 | down 13% | no change once the baseline weight relationship was controlled for |
| Week 22 | down 21% | reduced by more than the lower body weight predicted |
Body weight was the principal determinant of ambulatory energy expenditure, though the authors note the relationship was not one to one. Their conclusion was that after significant weight loss, “reduced-obese persons will expend less energy for the same activity, even after accounting for the decrease in body weight”, and that weight-based estimates of exercise energy expenditure may therefore be inappropriate afterwards.
That last clause describes exactly what a wrist-worn estimate is doing. This was eleven women on a very low calorie diet in 1995, not a study of any medication, and it is cited here for the mechanism rather than for any figure to expect.
Two routes from your weight to the number
Your body mass reaches the active-energy figure twice, and neither route involves your fitness.
The first is physical. Less mass carried over the same distance is less work, so fewer calories, and the study above suggests the drop can exceed what the weight change alone would predict.
The second is computational. The estimate is a model, and your weight is one of its inputs, the same way it is an input to the cardio fitness estimate. Updating your weight in Apple Health updates an input. Peptrend writes body mass to Health, and only weigh-ins typed into the app, so a logged weigh-in is also a change to a model input. The ten fitness readings travel the other way and are read-only.
Reading the line in the screenshot
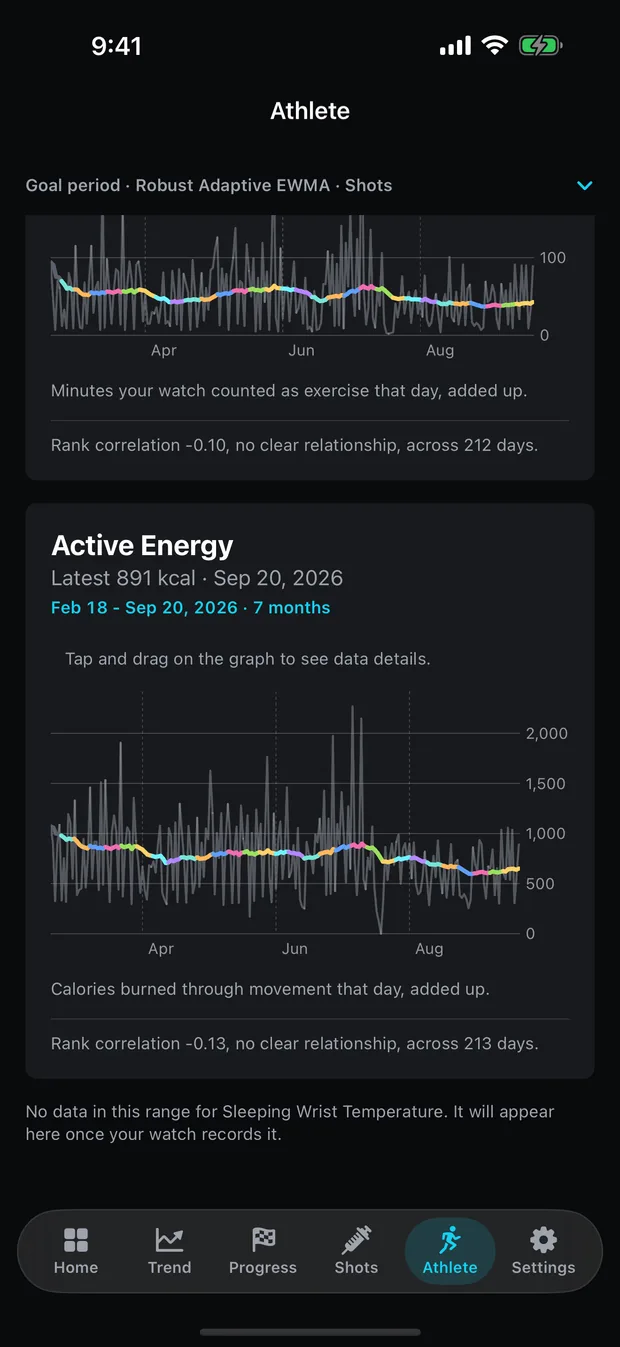
The seven months above show active energy hovering around 750 kcal with a great deal of daily spread, and the app reports “Rank correlation -0.13, no clear relationship, across 213 days”. Exercise minutes above it reports -0.10 across 212 days, also no clear relationship.
Both coefficients are Spearman’s rank correlation, reported only once at least fourteen paired days exist, with a strength word chosen from fixed bands. Below 0.2 reads “no clear relationship”. The app’s caution under the legend applies to both: “Describes what happened together, not what caused what.”
A near-zero coefficient is not proof of absence either. It says these two series did not move together monotonically over these days in this one person, which is a narrow statement about a small sample with nothing held steady.
Underneath, a line reads that there is no data in this range for sleeping wrist temperature and that it will appear once the watch records it. The tab draws what it has and names what it lacks, rather than showing a blank card that reads as a broken feature.
Why these two charts look spikier than the rest
A summed metric and an averaged one behave differently on screen, and the tab draws both without smoothing that difference away. Averaged metrics such as resting heart rate move within a narrow band, because a day’s samples pull each other towards the middle. Summed metrics swing between zero and whatever your biggest day held.
The active energy chart above runs from near zero to over 2,000 kcal on the same axis. That range is real rather than a rendering artefact, and it is why the smoothed line matters more here than on the calmer metrics: the daily series on its own is close to unreadable.
The y axis is fitted to the data and clamped to what is physically possible rather than sharing a fixed proportion across metrics. Blood oxygen lives between 0.90 and 0.99 while active energy runs across three orders of magnitude, and one proportional rule would either flatten the first or strand the second. The margin also shrinks with the data, so a nearly flat week is not magnified into drama it does not contain.
What to watch instead
If the question is whether you trained, read exercise minutes. It is the metric on the tab that does not carry your body mass, so it separates the amount of training from the cost of doing it.
If the question is whether a session was harder than usual, active energy is informative within a stable weight but misleading across one. Compare like with like: a month against the adjacent month rather than against a period when you were noticeably heavier.
And if the point of the exercise is to hold on to muscle while losing weight, none of the ten metrics measures that. Body composition is not something a watch records, and Peptrend does not estimate it. That measurement comes from a scan.
Peptrend logs what you enter and does arithmetic on it. It does not predict, recommend or promise, and it holds no opinion about which direction any of these metrics should go. What to do about your training belongs with you and a professional who knows your situation.
For the companion cases, VO₂ max and what the number measures covers a metric with body mass in its units, and resting heart rate and what the trials measured covers one where randomised evidence exists and a personal chart still cannot reproduce it. What to log with every dose covers the other half of the pairing, and the fifteen methods documents the smoothing that draws every line here.
Common questions
Why did my calorie burn drop when I did not change my workouts?
Moving a lighter body costs less energy, and active energy measures that work. A study of women who lost 21% of their body weight found the energy cost of walking fell by more than the weight change alone predicted.
Which metric shows whether I actually trained?
Exercise minutes. It counts the time your watch classified as exercise and does not scale with your body mass, so it separates the amount you trained from the cost of carrying yourself while you did it.
Are exercise minutes and active energy averaged over a day?
No, they are added up. Every other metric on the tab averages the day's samples, because averaging minutes or calories would report the mean length of a workout rather than how long you trained.
What happens to a metric my watch has never recorded?
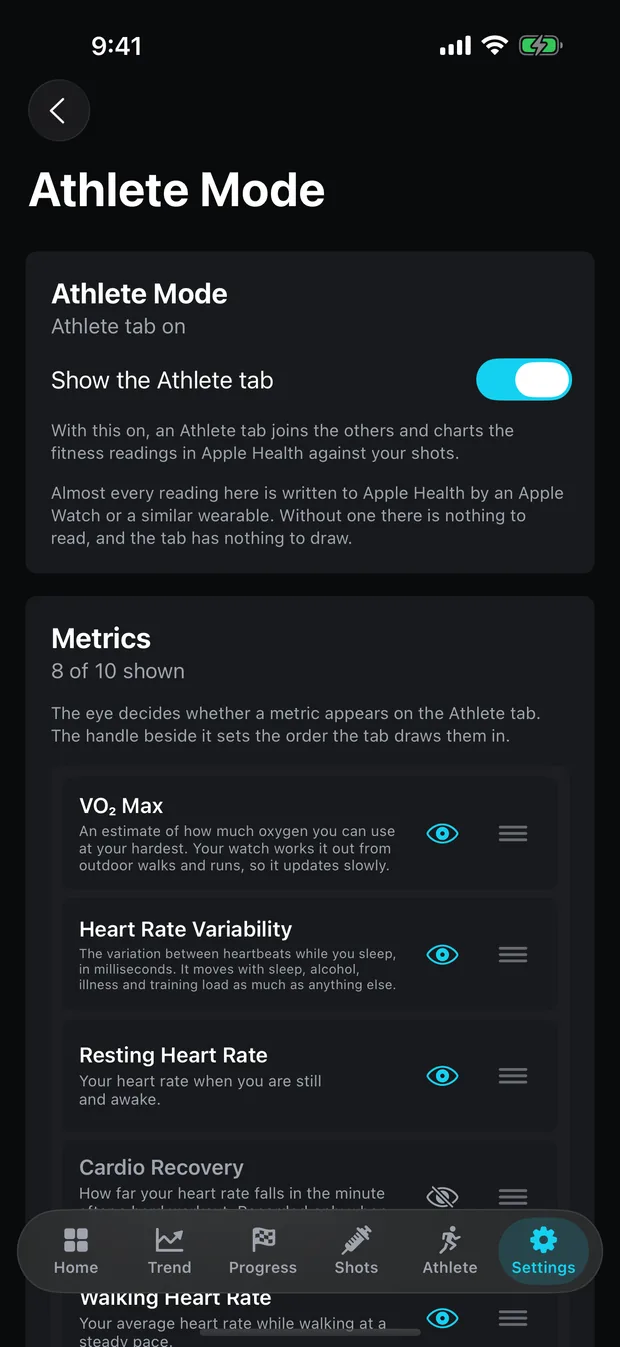
The tab draws the metrics it has and names the rest in a line underneath, saying the metric will appear once your watch records it. Cardio recovery and respiratory rate start hidden for that reason.
Sources
- Foster GD, Wadden TA, Kendrick ZV, Letizia KA, Lander DP, Conill AM. The energy cost of walking before and after significant weight loss. Med Sci Sports Exerc. 1995;27(6):888-94
- Apple Developer Documentation: HKQuantityTypeIdentifier.activeEnergyBurned
- Apple Developer Documentation: HKQuantityTypeIdentifier.appleExerciseTime