Does a GLP-1 raise resting heart rate? What the trials measured
In a 2026 meta-analysis of 12 randomised trials covering 15,313 non-diabetic adults with overweight or obesity, GLP-1 receptor agonists raised resting heart rate by a pooled 3.47 bpm against placebo. That describes those drugs in those trials. One person's watch readings cannot separate a few beats per minute from sleep, season, training and weight change.
Yes, in randomised trials, by a small and well-characterised amount. A 2026 systematic review pooled 12 randomised controlled trials covering 15,313 non-diabetic adults with overweight or obesity and found GLP-1 receptor agonists raised resting heart rate by 3.47 bpm against placebo, with a 95% confidence interval of 2.65 to 4.29. That is a statement about those drugs, in those trials, in that population. It is not a prediction about you, and your watch is not equipped to confirm it.
What the meta-analysis found
The pooled figure covers several drugs that behave differently from each other. Of the 15,313 participants, 9,128 took a GLP-1 receptor agonist and 6,185 were controls.
| Drug | Mean difference vs placebo | 95% CI |
|---|---|---|
| All GLP-1 receptor agonists pooled | +3.47 bpm | 2.65 to 4.29 |
| Semaglutide, subcutaneous | +3.35 bpm | 1.69 to 5.01 |
| Semaglutide, oral | +4.50 bpm | 3.11 to 5.89 |
| Tirzepatide | +2.05 bpm | 0.96 to 3.13 |
Two things are worth holding on to. The effect is consistent enough across trials that the confidence interval sits well clear of zero, and it is small enough in absolute terms that three or four beats per minute is the whole of it.
This describes the medications. It says nothing about what any individual reading on your wrist means, and none of it is guidance about whether to take anything. That conversation belongs with a prescriber.
Why your own chart cannot show you this
A randomised trial can attribute a three-beat difference because it holds everything else still. Participants are assigned at random, a control group takes placebo, and the comparison is between groups measured the same way over the same period. Take those away and a three-beat difference becomes invisible.
Your own readings have none of that structure. Resting heart rate moves with sleep, alcohol, illness, travel, training load, ambient temperature and time of year, and it moves by more than three beats on an ordinary bad week. There is no control version of you taking nothing. And the thing most likely to be changing alongside your doses is your body mass, which has its own well-documented relationship with resting heart rate.
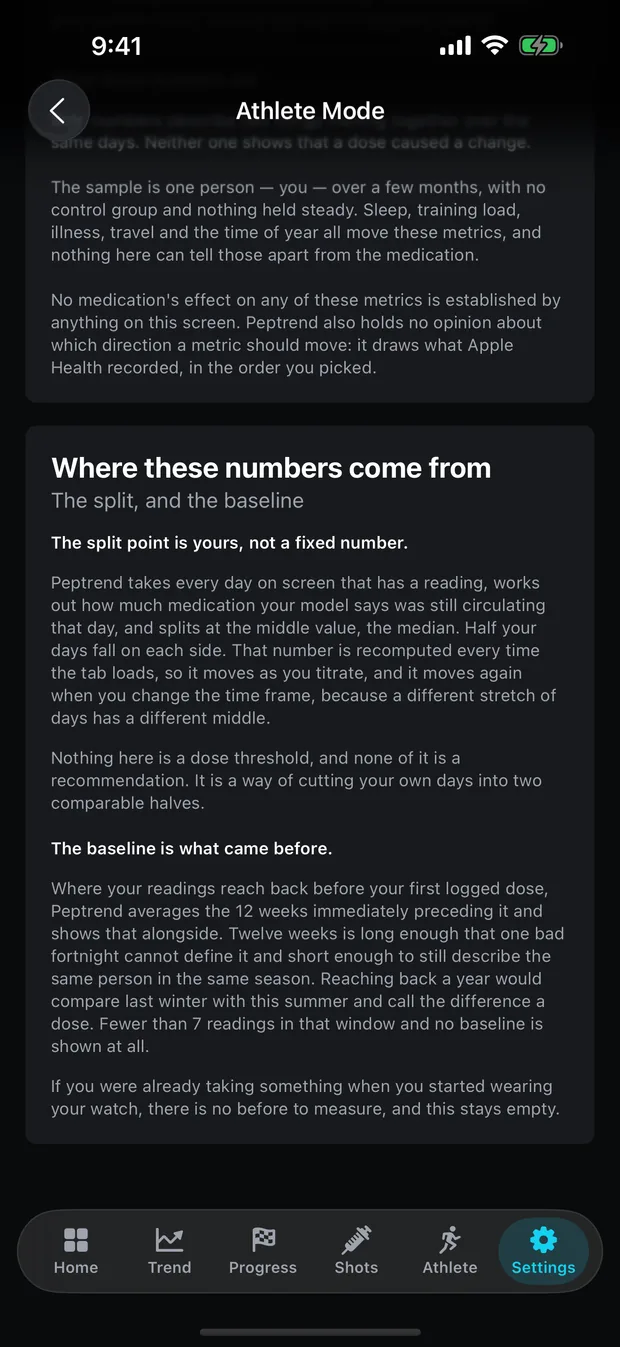
The app states this where the numbers appear rather than burying it: “The sample is one person — you — over a few months, with no control group and nothing held steady. Sleep, training load, illness, travel and the time of year all move these metrics, and nothing here can tell those apart from the medication.”
What your watch is calling resting heart rate
The figure is not a measurement you take, and it is not your lowest heart rate of the day. Apple Watch samples heart rate through the day and derives a resting value from the periods you were still and awake, writing one number per day into Apple Health. Peptrend reads that daily value and does not compute its own.
Two consequences follow. A day with little still-and-awake time gives the estimate less to work from, so an unusual day can move it for reasons that have nothing to do with your body. And because it arrives as one value per day, the daily series is already a summary, which is why the raw grey line in the chart is still visibly noisy even though it is not showing individual beats.
Athlete Mode buckets readings by day and averages the day’s samples for this metric, as it does for every metric except exercise minutes and active energy, which it adds up instead.
A rising line with a moderate correlation
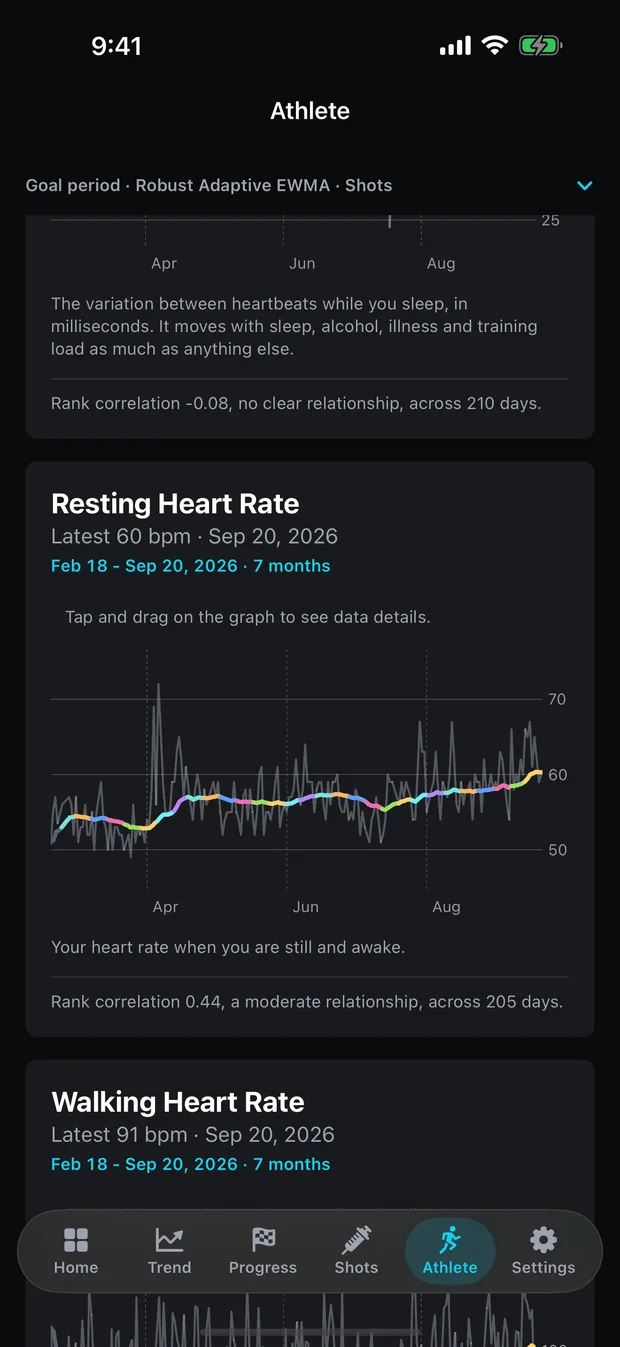
The screenshot above shows exactly the case that tempts people. Across seven months the smoothed line climbs from around 53 to around 60 bpm, doses run throughout, and the app reports “Rank correlation 0.44, a moderate relationship, across 205 days”.
That is a real number, honestly computed, and it establishes nothing about cause. Two series moving together produce the same coefficient whether one drives the other, both follow a third thing, or the coincidence is a coincidence. February to September also covers a season change, and resting heart rate has a seasonal component. A correlation cannot tell those apart, and Peptrend does not claim it can.
The word “moderate” grades the size of the coefficient and nothing else. The bands are fixed: below 0.2 reads “no clear relationship”, below 0.4 “a weak relationship”, below 0.6 “a moderate relationship”, and above that “a strong relationship”. They are deliberately vague because a precise-sounding label on a noisy single-person series would claim more than the data supports.
How the number is built
Spearman’s rank correlation, not Pearson. Rank-based methods only assume the relationship is monotonic and assume nothing about the distributions, so one sleepless night cannot drag the coefficient the way it would drag a Pearson figure.
Nothing is reported below fourteen paired days. Under that the card says how many days it has instead, because a correlation over a handful of readings is noise wearing a decimal point. Days with nothing circulating count, and are the half the rest is compared against.
The setting is off by default, and so is the split-average block beside it. Both are things you switch on having read the caution, rather than things that meet you on first launch. Athlete Mode itself is off by default too, and asks for the ten fitness types only when you turn it on. They are read-only; body mass remains the only type Peptrend writes to Apple Health.
What to do with the number
Read it as a description of a window, then change the window. The split point the app uses is your own median circulating amount across the days on screen, recomputed every time the tab loads, so it moves as you titrate and moves again when you change the time frame. A relationship that survives 1M, 3M and a year is more interesting than one that appears in a single quarter.
Log what else was happening. A fortnight of poor sleep or a heavy training block is exactly the sort of thing that moves resting heart rate and will not appear in a dose log at all.
And if your resting heart rate concerns you, the number to act on is the one a clinician sees, not the one a correlation coefficient suggests. Peptrend is not a medical device, does not diagnose, treat, cure, or prevent any medical condition, and gives no medical advice. The full disclaimer sets out what the statistics on the Athlete tab are and are not.
For the other half of this problem, VO₂ max and what the number measures covers a metric whose units carry your body mass directly, and signal and noise on your scale is the same argument for weigh-ins. Half-life and steady state explains how the circulating estimate that the split point uses is derived.
Common questions
How much do GLP-1 receptor agonists raise resting heart rate?
A 2026 meta-analysis of 12 randomised trials in 15,313 non-diabetic adults with overweight or obesity found a pooled increase of 3.47 bpm against placebo, with a 95% confidence interval of 2.65 to 4.29. Individual drugs in that analysis ranged from about 2 to about 4.5 bpm.
Will my Apple Watch show the increase?
Not reliably. A few beats per minute sits inside the range one person's readings move through anyway on sleep, alcohol, illness, training and season, and your watch is measuring one person with no control group.
Does Peptrend say a dose changed my heart rate?
No. It charts the readings beside the doses and can report a rank correlation once fourteen or more days carry both. The app holds no opinion about which direction any metric should move, and states that nothing on the screen establishes a medication's effect.
What does a moderate correlation mean here?
It means the coefficient landed between 0.4 and 0.6, and nothing more. The word grades the size of the number, not the strength of any explanation, and the same figure would appear if both series were moving with a third thing such as the season.
Sources
- Zhang Y, Zhang C, Gong X, et al. Effect of glucagon-like peptide-1 receptor agonists on heart rate in non-diabetic individuals with overweight or obesity: a systematic review and pairwise and network meta-analysis of randomized controlled trials. Eur J Med Res. 2026;31:318
- Apple Developer Documentation: HKQuantityTypeIdentifier.restingHeartRate
- Wikipedia: Spearman's rank correlation coefficient