
Is it a real plateau? Why two weigh-ins a fortnight apart can't say
Compare the trend line's two ends rather than two mornings, which throw away everything between them. On one user's log — 84 weigh-ins over 225 days — 13 of 67 fortnight-apart comparisons showed no loss on the scale, and in all 13 the line was lower at the end. After a weigh-in lower than everything in the previous 30 days, the next came in higher 68.4% of the time.
Is a flat fortnight on the scale a real plateau?
Usually not. Take one user’s log — 84 weigh-ins over 225 days — and match every weigh-in to the one closest to a fortnight earlier, within three days. That gives 67 comparisons. Thirteen of them, 19.4%, show no loss: the later reading is equal to or higher than the earlier one. In all thirteen, the smoothed line was lower on the second date than on the first.
Subtracting one weigh-in from another throws away everything between them and keeps two numbers, each of which sits an average of 1.4 lb away from the trend line on the day. Fit a line through the whole fortnight instead and the answer changes often enough to matter: across 92 fourteen-day windows holding at least six real weigh-ins, the first-to-last difference shows no loss in 32 and the least-squares slope points upward in 19, but the two disagree about which direction the fortnight went in 15 of them.
You can also measure how much the choice of mornings is worth. Allow yourself to have weighed on any of the first three days and any of the last three days of a fortnight, and the readable net change spans a median of 1.4 lb — up to 5.4 lb in the worst window. A fortnight of this log’s underlying drift comes to about the same 1.4 lb, so which mornings you happened to stand on the scale is worth as much as the progress you were trying to read.
Some of that spread is a calendar effect rather than luck. Orsama and colleagues, working from 4,657 measurements taken by 80 adults, found weight ran highest on Sunday and Monday and lowest on Friday. Start your fortnight on a Friday and end it on a Monday and you have built a gain into the comparison before anything happened. Why you gain weight overnight covers where the daily swing comes from.
How often does the trend line actually stop falling?
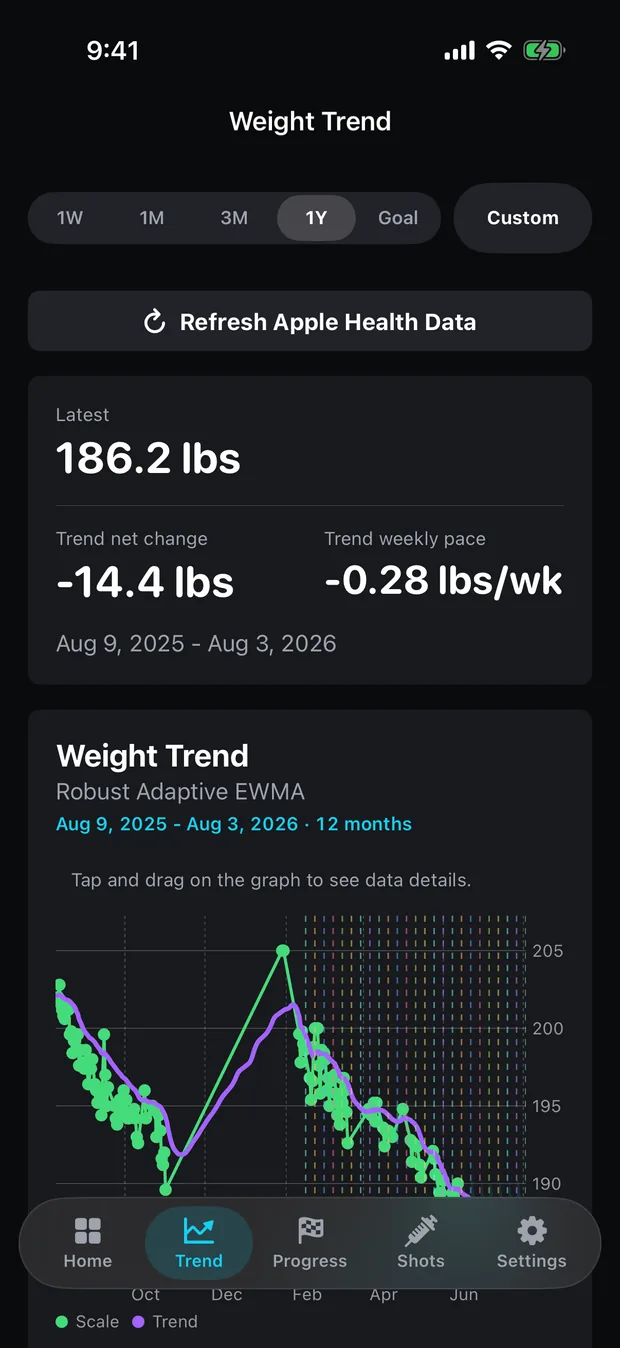
On this log the Robust Adaptive EWMA line failed to fall on 23 of its 225 days — 10%. The two longest unbroken runs are five days and three days. There is no month-long flat stretch in this line to explain away.
How the line is drawn matters to that. It runs on 226 daily values, of which only 84 are real weigh-ins; the other 142 are filled in between readings, and the longest gap runs 45 days. Where the line crosses a gap it is following straight linear interpolation rather than any measurement, so a smooth descent there is arithmetic and not evidence. A cohort of 9,768 smart-scale users weighed an average of 2.80 times a week, so gaps like that are what ordinary logging looks like. Interpolation changes the line has the rest of that argument, including which of the fifteen methods fill gaps and which refuse.
Real plateaus are well studied. Clinical weight loss in individuals typically stabilises around six months, while validated models of dynamic energy balance put the plateau between one and two years. Thomas and colleagues closed most of that gap in 2014 by writing intermittent lapses in diet adherence into the model, and concluded those lapses are a major contributor to the early plateau. Peptrend has nothing to say about which of those is happening to you — it never sees what you ate. What it can do is keep a fortnight of sampling noise from being filed under either heading.
How far above your lowest weight are you sitting? (drawdown)
Fund managers have a name for the space between where you are and the best you have done. Magdon-Ismail and Atiya, writing in Risk on 1 October 2004, define maximum drawdown as the maximum loss from a market peak to a market nadir, and say plainly what it is for: it “measures how sustained one’s losses can be”. Flip the sign and the peak becomes your lowest recorded weight.
| Distance above the running low | Raw weigh-ins | Trend line |
|---|---|---|
| Maximum ever reached | 4.6 lb | 0.2 lb |
| Mean across the whole log | 1.12 lb | 0.01 lb |
| Share more than 1 lb above | 42.9% | 0% |
| Share more than 2 lb above | 21.4% | 0% |
| Share more than 5 lb above | 0% | 0% |
| Longest stretch without a new low | 59 days | 11 days |
Raw shares are over the 84 weigh-ins; trend shares are over the 226 daily points the line is drawn on. On this log the line almost never sat above its own running low, which is why the right-hand column is nearly all zeros. The drawdown you actually live through is in the left-hand one.
Twenty-one of the 84 weigh-ins set a new record low, 25.0%, in a log that finished 22.0 lb down. Three times in four, the scale printed a number the log had already beaten.
The longest run on the raw scale without a new low, 59 days, is mostly not a stall at all: 45 of those days are the log’s single longest gap, when nobody stood on the scale and so nobody could set a low. Drawdown makes no attempt to tell a gap from a stall from a regain. It reports one quantity, how far above your best you are living, and it stays legible while you work out which of the three you have.
Why is my weight higher the morning after a record low? Regression to the mean
After a weigh-in lower than every reading of the previous 30 days — 19 such occasions in this log — the next weigh-in came in higher 68.4% of the time, by an average of 0.77 lb. Across all 83 intervals in the same file the base rate is 36.1% and the average change is −0.27 lb. Nothing in the body changed between those two populations. The selection rule changed.
Barnett, van der Pols and Dobson define it as a phenomenon that “can make natural variation in repeated data look like real change”: unusually large or small measurements tend to be followed by ones nearer the mean. Galton named it in 1886, after noticing that very tall parents had children closer to average height than they were.
The mechanism takes one line. A weigh-in is the trend plus a noise term. Pick out the smallest reading of the last month and you have, by construction, picked the reading with the most negative noise attached. The next reading gets a fresh draw, which is almost certainly less extreme. Sorting the log’s weigh-ins by their distance from the trend line on the day makes the effect symmetric and monotone:
| Weigh-ins sorted by distance from the trend line | n | Next weigh-in changes by | Trend line changes by |
|---|---|---|---|
| Furthest below (−4.4 to −2.4 lb) | 16 | +1.04 lb | −0.30 lb |
| −2.3 to −1.7 lb | 16 | −0.25 lb | −0.25 lb |
| −1.6 to −1.1 lb | 16 | −0.44 lb | −0.27 lb |
| −1.1 to −0.3 lb | 16 | −0.44 lb | −0.16 lb |
| Closest to or above the line (−0.3 to +0.6 lb) | 19 | −1.09 lb | −0.23 lb |
The “next weigh-in” column runs from a strong pull upward to a strong pull downward, with no physiology attached to either end. The column beside it sits near a quarter of a pound down in every band, which is the whole point of having it there.
Why doesn’t the trend line bounce back the way the scale does?
Over the same 19 pairs of dates that produced a 68.4% chance of a raw gain, the trend line rose not once, for a mean change of −0.28 lb. The scale came back up three quarters of a pound; the line carried on down.
Robust Adaptive EWMA, the method the app selects out of the box, weights each new reading somewhere between α = 0.04 and α = 0.22 depending on how directional the last fortnight has been, and scales that weight down further when a reading lands more than 2.5 robust standard deviations from the prior trend. A record low that is mostly noise is exactly the reading that trips the second mechanism. the method that sits furthest from the scale works through the adaptive half; bodyweight is a time series sets out why the daily noise on this file runs 11.9 times the daily drift. All fifteen methods, with their formulas and shipped parameters, are on the methods page.
What does the app show after a bad fortnight?
The Progress tab regresses a line through the whole window. Its weekly rate is an ordinary least-squares regression of weight against time across whatever range you have selected, multiplied by seven, and it returns nothing at all unless the window spans at least three days — a deliberate refusal to turn two weigh-ins hours apart into a rate. A unit test asserts the regression is used instead of endpoint differencing.
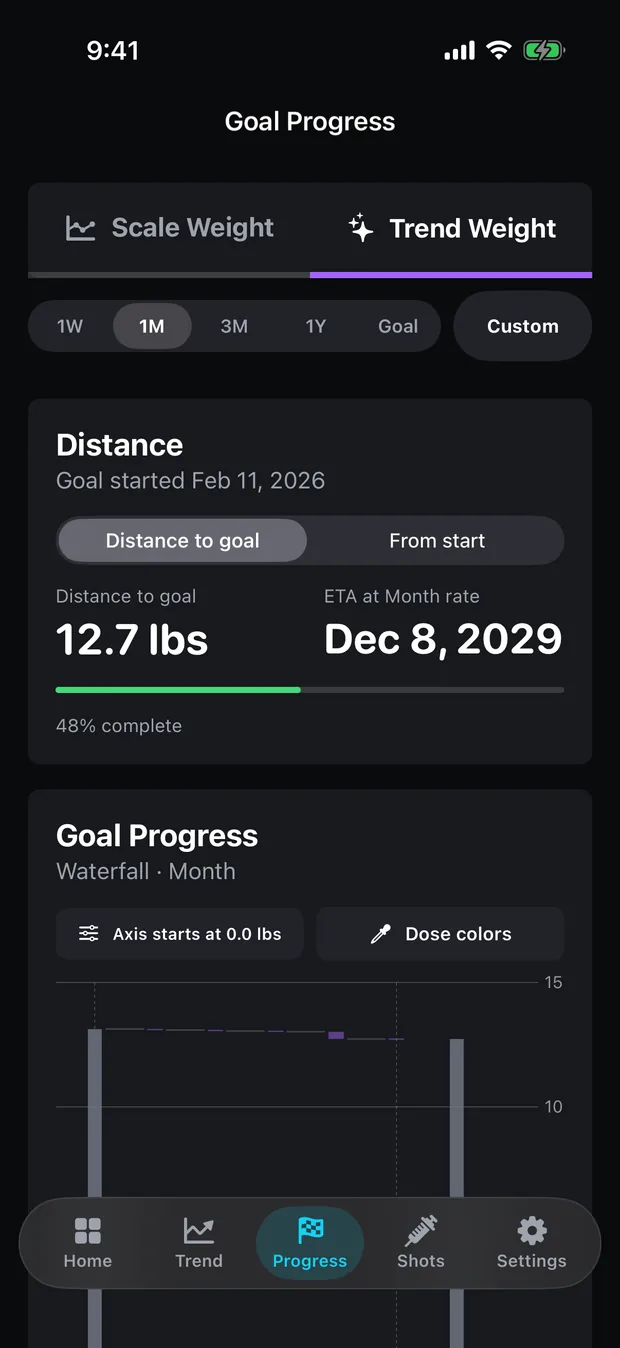
The weekly waterfall on the same tab breaks the goal into seven-day buckets and shows what each week contributed, with the distance still to go carried at the end. A fortnight that reads as a gain becomes one or two positive bars sitting among the negative ones, sized against the weeks either side of them. Both the waterfall and the smoothed rate are Pro; the raw Scale Actual Rate stays free, on the grounds that it is arithmetic on weigh-ins you already own.
Goal setup caps the plan at 1.5 lb per week in both directions and in both scheduling modes, so a discouraging month cannot be answered by writing a steeper target. How fast is too fast to plan for covers that rail and the projection maths behind the finish date. There is no account and no server of Peptrend’s own; what syncs goes through your own private iCloud database, and the privacy page sets out the detail. If a figure on your own log looks wrong, support will go through the arithmetic with you.
Common questions
How do I know if it's a plateau or just water weight?
Compare the trend line's endpoints rather than the scale's. In one user's log of 84 weigh-ins, 13 of 67 fortnight-apart weigh-in pairs showed no loss on the raw scale, and in all thirteen the smoothed line had fallen over the same two dates.
Is a two- or three-week stall normal?
Flat stretches on the scale are ordinary on this log. The raw weigh-ins went as long as 59 days without setting a new low, and 21.4% of them sat more than 2 lb above the running low. Of 92 fourteen-day windows holding at least six real weigh-ins, the first-to-last difference and the least-squares slope through every point disagreed about the direction of travel in 15 — about one window in six.
Why is my weight always higher the day after a new low?
Regression to the mean. A record low is the reading with the most negative noise attached; the next reading draws fresh noise, so on average it comes back toward the line. On this log a weigh-in lower than every reading of the previous 30 days was followed by a gain 68.4% of the time, against a 36.1% base rate, with no change in the body required.
What is drawdown, applied to bodyweight?
How far you currently sit above the lowest reading you have recorded so far, and how long you have sat there. Borrowed from fund performance, where Magdon-Ismail and Atiya define maximum drawdown as the maximum loss from a market peak to a market nadir. On this log, 21.4% of weigh-ins landed more than 2 lb above the running low.
Sources
- Barnett, van der Pols & Dobson — 'Regression to the mean: what it is and how to deal with it', International Journal of Epidemiology 34(1):215–20 (2005)
- Martin Bland — 'Regression towards the mean', University of York
- Magdon-Ismail & Atiya — 'Maximum drawdown', Risk, 1 October 2004
- Thomas et al. — 'Effect of dietary adherence on the body weight plateau: a mathematical model incorporating intermittent compliance with energy intake prescription', American Journal of Clinical Nutrition (2014)
- Orsama et al. — 'Weight Rhythms: Weight Increases during Weekends and Decreases during Weekdays', Obesity Facts (2014)
- Vuorinen et al. — 'Frequency of Self-Weighing and Weight Change: Cohort Study With 10,000 Smart Scale Users', JMIR (2021)